<?xml version="1.0" encoding="utf-8"?><?xml-stylesheet type="text/xml" href="https://mattprotopapas.github.io/feed.xslt.xml"?><feed xmlns="http://www.w3.org/2005/Atom" ><generator uri="https://jekyllrb.com/" version="3.10.0">Jekyll</generator><link href="https://mattprotopapas.github.io/feed.xml" rel="self" type="application/atom+xml" /><link href="https://mattprotopapas.github.io/" rel="alternate" type="text/html" /><updated>2026-07-22T19:27:31+00:00</updated><id>https://mattprotopapas.github.io/feed.xml</id><title type="html">Matt Pro Analytics Blog</title><subtitle>Detailed posts on how AI &amp; Analytics can help companies make data-driven decisions.</subtitle><author><name>Matt Protopapas</name></author><entry><title type="html">Lead Conversion Analytics For Small Companies</title><link href="https://mattprotopapas.github.io/2026/07/22/lead-conversion-analytics-for-small-companies/" rel="alternate" type="text/html" title="Lead Conversion Analytics For Small Companies" /><published>2026-07-22T00:00:00+00:00</published><updated>2026-07-22T00:00:00+00:00</updated><id>https://mattprotopapas.github.io/2026/07/22/lead-conversion-analytics-for-small-companies</id><content type="html" xml:base="https://mattprotopapas.github.io/2026/07/22/lead-conversion-analytics-for-small-companies/"><![CDATA[<h1 id="why-lead-conversion--customer-lifetime-value-analytics-matter-for-smes">Why Lead Conversion &amp; Customer Lifetime Value Analytics Matter for SMEs</h1>

<p>For small and medium-sized enterprises (SMEs), every lead costs money to acquire — whether through paid ads, content marketing, referrals, or a sales team’s time. But generating leads is only half the story. What really determines growth is what happens <em>after</em> a lead comes in: how many turn into paying customers, how long that takes, and how much those customers are ultimately worth.</p>

<p>This kind of thinking was important for myself, especially last year. As I was working full time on a project and at the same time I was coordinating a team to deliver a Power BI dashboard backed with Azure Data Factory pipelines, and apps that read Purview data from Azure Monitor, it was extremely difficult for me to find the time to create content (videos, posts) to try to find new leads. So I was thinking whether I should hire someone to create some linkedin posts for the company, or even linkedin ads.</p>

<p>To make such decisions you have to first get a clear picture of what a lead might cost, what opportunities might those leads create, how many leads convert to opportunities and then customers, and at the end of the day, how much I could gain from an average customer (the Customer Lifetime Value). Without this info, I wouldn’t be able to evaluate whether it would make sense to spend money on payed ads for example.</p>

<p>This is where <strong>lead conversion analytics</strong> and <strong>customer lifetime value (CLV)</strong> analysis come in. Together, they gave me (and SMEs in general) the visibility to make sales and marketing decisions based on evidence rather than guesswork — without needing an enterprise-scale data team to do it.</p>

<h2 id="what-lead-conversion-analytics-actually-gives-you">What lead conversion analytics actually gives you</h2>

<table>
  <thead>
    <tr>
      <th>Benefit</th>
      <th>Why it matters for SMEs</th>
    </tr>
  </thead>
  <tbody>
    <tr>
      <td><strong>Measures marketing ROI</strong></td>
      <td>Identifies which channels (Google Ads, social media, referrals, email, etc.) generate customers — not just leads.</td>
    </tr>
    <tr>
      <td><strong>Improves sales performance</strong></td>
      <td>Reveals where prospects drop out of the sales process so teams can improve follow-up and messaging.</td>
    </tr>
    <tr>
      <td><strong>Optimizes marketing spend</strong></td>
      <td>Helps allocate limited budgets toward the highest-converting campaigns.</td>
    </tr>
    <tr>
      <td><strong>Increases revenue</strong></td>
      <td>Even small improvements in conversion rates can significantly increase sales without generating more leads.</td>
    </tr>
    <tr>
      <td><strong>Enables forecasting</strong></td>
      <td>Historical conversion rates help predict future sales and cash flow.</td>
    </tr>
    <tr>
      <td><strong>Improves customer understanding</strong></td>
      <td>Shows which customer segments, industries, or demographics convert best.</td>
    </tr>
    <tr>
      <td><strong>Supports data-driven decisions</strong></td>
      <td>Replaces assumptions with measurable evidence about what actually works.</td>
    </tr>
  </tbody>
</table>

<p>For a resource-constrained SME, that last point is arguably the most important. Bigger companies can afford to run experiments and absorb some marketing waste. SMEs generally can’t — every dollar needs to work harder, and analytics is what tells you which dollars are working.</p>

<h2 id="a-practical-example">A practical example</h2>

<p>Lets do a frictious example. Let’s assume we have an SME that sells cosmetics (e.g. my wife’s e-shop). Let’s assume that SME generates 1,000 leads per month, split across three channels:</p>

<ul>
  <li>Paid ads: 500 leads</li>
  <li>Organic search: 300 leads</li>
  <li>Referrals: 200 leads</li>
</ul>

<p>Without analytics, the business only knows it received 1,000 leads. That’s it.</p>

<p>With conversion analytics, it can break the funnel down like this:</p>

<table>
  <thead>
    <tr>
      <th>Source</th>
      <th>Leads</th>
      <th>Customers</th>
      <th>Conversion Rate</th>
    </tr>
  </thead>
  <tbody>
    <tr>
      <td>Paid Ads</td>
      <td>500</td>
      <td>10</td>
      <td>2%</td>
    </tr>
    <tr>
      <td>Organic Search</td>
      <td>300</td>
      <td>18</td>
      <td>6%</td>
    </tr>
    <tr>
      <td>Referrals</td>
      <td>200</td>
      <td>24</td>
      <td>12%</td>
    </tr>
  </tbody>
</table>

<p>The insight: <strong>referrals convert six times better than paid ads.</strong> Armed with that, the business might:</p>

<ul>
  <li>Invest more in a referral program.</li>
  <li>Improve targeting or messaging for paid ads.</li>
  <li>Create more content to boost organic search further.</li>
</ul>

<p>None of these decisions require more spend — just better allocation of the spend already happening.</p>

<h2 id="more-advanced-insights-as-the-business-matures">More advanced insights, as the business matures</h2>

<p>Once the basics are in place, the same kind of analysis can start answering sharper questions:</p>

<ul>
  <li>Which sales representative has the highest close rate?</li>
  <li>How long does it take to convert a lead?</li>
  <li>Which products convert best?</li>
  <li>What is the conversion rate at each stage of the sales funnel?</li>
  <li>Which customer profiles have the highest lifetime value?</li>
  <li>Which marketing campaigns generate the most <em>profitable</em> customers — not just the most customers?</li>
</ul>

<p>That last question is why CLV matters alongside conversion rate. A channel that converts leads at a lower rate but brings in customers who stick around and spend more can be more valuable than a channel with a higher conversion rate but low-value customers. Conversion rate tells you <em>how many</em> customers you’re winning; CLV tells you whether they’re <em>worth winning</em>.</p>

<h2 id="key-metrics-worth-tracking">Key metrics worth tracking</h2>

<p>One way to approach this problem is to create a BI dashboard to track key metrics. A useful lead conversion and CLV dashboard, may include:</p>

<ul>
  <li>Overall lead conversion rate</li>
  <li>Conversion rate by marketing channel</li>
  <li>Cost per lead (CPL)</li>
  <li>Cost per acquisition (CPA)</li>
  <li>Lead-to-opportunity conversion</li>
  <li>Opportunity-to-customer conversion</li>
  <li>Sales cycle length</li>
  <li>Customer acquisition cost (CAC)</li>
  <li>Customer lifetime value (LTV)</li>
  <li>Return on marketing investment (ROMI)</li>
</ul>

<p>You don’t need all of these on day one. Start with overall conversion rate and conversion by channel — they’re the fastest to set up and usually surface the biggest, most actionable insights first.</p>

<h2 id="the-business-impact-in-real-numbers">The business impact, in real numbers</h2>

<p>Consider an SME with:</p>

<ul>
  <li>Current conversion rate: 5%</li>
  <li>Leads per month: 500</li>
  <li>Average sale: $1,000</li>
</ul>

<p>That yields 25 customers and <strong>$25,000</strong> in monthly revenue.</p>

<p>Now suppose analytics helps the business identify and fix a bottleneck — better lead follow-up, a clearer sales pitch, or simply reallocating spend toward higher-converting channels — and the conversion rate rises to 6%. The same 500 leads now produce 30 customers and <strong>$30,000</strong> in monthly revenue.</p>

<p>That’s a <strong>20% increase in revenue with zero additional lead generation spend.</strong> This is the core case for lead conversion analytics: it very often unlocks more revenue from the marketing and sales effort already underway, rather than requiring the business to spend more to get more.</p>

<h2 id="try-it-yourself-a-demo-you-can-run-in-minutes">Try it yourself: a demo you can run in minutes</h2>

<p>To make these concepts concrete, I’ve built a small open-source demo: <strong><a href="https://github.com/MattProtopapas/Leads-Valuation">Leads-Valuation</a></strong>. It’s a Python-based pipeline that:</p>

<ol>
  <li>Generates a batch of synthetic (fake) leads — names, companies, industries, revenue, lead source, etc.</li>
  <li>Validates that data against a strict set of business rules.</li>
  <li>Simulates the leads moving through a sales funnel (Lead → Opportunity → Customer) using configurable conversion rates.</li>
  <li>Produces an Excel workbook with the input data, the funnel results, and a KPI summary sheet — the same kind of view described above, generated automatically.</li>
</ol>

<p>It’s designed as a learning and demonstration tool, so you can see how conversion-rate and CLV logic works end-to-end without connecting it to a real CRM.
As a matter of fact I used an LLM (AI tool) to create everything in less than 15 min. For a user of this PoC (Proof of Concept - as we sometimes call these things in corporate settings) things are even simpler. Just download the code from the <a href="https://github.com/MattProtopapas/Leads-Valuation">Github repository</a>, and ask your AI tool of choice (I used Claude) to generate a Python environment and the dependencies listed in <code class="language-plaintext highlighter-rouge">requirements.txt</code>. Then run <code class="language-plaintext highlighter-rouge">analysis.py</code>. More details below:</p>

<h3 id="downloading-the-code-no-git-experience-needed">Downloading the code (no Git experience needed)</h3>

<p>You don’t need to know Git or the command line to get the code onto your computer:</p>

<ol>
  <li>Go to the repository: <strong><a href="https://github.com/MattProtopapas/Leads-Valuation">github.com/MattProtopapas/Leads-Valuation</a></strong></li>
  <li>Click the green <strong><code class="language-plaintext highlighter-rouge">&lt;&gt; Code</code></strong> button near the top of the page.</li>
  <li>In the dropdown, click <strong>“Download ZIP”</strong>.</li>
  <li>Once downloaded, right-click the ZIP file and choose <strong>“Extract All…“</strong> (Windows) to unzip it into a regular folder.</li>
  <li>Open that extracted folder — that’s the project.</li>
</ol>

<p>If you’re comfortable with Git, <code class="language-plaintext highlighter-rouge">git clone https://github.com/MattProtopapas/Leads-Valuation.git</code> does the same thing in one step — but the ZIP download works just as well and requires no tools beyond what’s already built into Windows.</p>

<h3 id="running-the-demo">Running the demo</h3>

<p>The project includes a <code class="language-plaintext highlighter-rouge">requirements.txt</code> file and detailed setup notes in <code class="language-plaintext highlighter-rouge">README.md</code> and <code class="language-plaintext highlighter-rouge">SETUP_GUIDE.md</code>, but the short version is:</p>

<ol>
  <li><strong>Install Python 3.8 or higher</strong>, if you don’t already have it, from <a href="https://www.python.org/downloads/">python.org</a>.</li>
  <li>Open the extracted folder in a terminal (PowerShell on Windows) and create a virtual environment:
    <div class="language-powershell highlighter-rouge"><div class="highlight"><pre class="highlight"><code><span class="n">python</span><span class="w"> </span><span class="nt">-m</span><span class="w"> </span><span class="nx">venv</span><span class="w"> </span><span class="o">.</span><span class="nf">venv</span><span class="w">
</span></code></pre></div>    </div>
  </li>
  <li>Install the dependencies:
    <div class="language-powershell highlighter-rouge"><div class="highlight"><pre class="highlight"><code><span class="o">.</span><span class="n">\.venv\Scripts\pip.exe</span><span class="w"> </span><span class="nx">install</span><span class="w"> </span><span class="nt">-r</span><span class="w"> </span><span class="nx">requirements.txt</span><span class="w">
</span></code></pre></div>    </div>
  </li>
  <li>Run the full pipeline with a single command:
    <div class="language-powershell highlighter-rouge"><div class="highlight"><pre class="highlight"><code><span class="o">.</span><span class="n">\.venv\Scripts\python.exe</span><span class="w"> </span><span class="nx">analysis.py</span><span class="w">
</span></code></pre></div>    </div>
  </li>
</ol>

<p><code class="language-plaintext highlighter-rouge">analysis.py</code> is the main script — it orchestrates the whole demo, from generating synthetic leads through to producing the final report. Running it will:</p>

<ul>
  <li>Generate synthetic lead data (<code class="language-plaintext highlighter-rouge">data/leads_input.csv</code>)</li>
  <li>Validate that data (<code class="language-plaintext highlighter-rouge">data/leads_validated.csv</code>)</li>
  <li>Run the funnel and KPI analysis</li>
  <li>Produce <code class="language-plaintext highlighter-rouge">lead_valuation_analysis.xlsx</code>, an Excel workbook with input leads, validated leads, opportunities, customers, and a KPI summary sheet</li>
</ul>

<p>Open that Excel file afterward to see the conversion funnel and KPIs laid out exactly as described earlier in this post. You can tweak the conversion rates and average CLV assumptions in <code class="language-plaintext highlighter-rouge">config.py</code> and re-run <code class="language-plaintext highlighter-rouge">analysis.py</code> to see how the numbers respond — a useful way to build intuition for how sensitive revenue is to small changes in conversion rate.</p>

<p>If you hit any snags along the way (PowerShell execution policy errors, missing Python, locked Excel files), the <code class="language-plaintext highlighter-rouge">SETUP_GUIDE.md</code> file in the repository walks through the most common issues and fixes.</p>

<blockquote>
  <p>Note: this demo uses synthetic, randomly generated data and is intended for educational and demonstration purposes only — see the repository’s <a href="https://github.com/MattProtopapas/Leads-Valuation/blob/main/DISCLAIMER.md">Disclaimer</a> for details. It’s a starting point for understanding the mechanics of lead conversion and CLV analysis, not a production-ready analytics tool.</p>
</blockquote>

<h3 id="understanding-the-results">Understanding the results</h3>

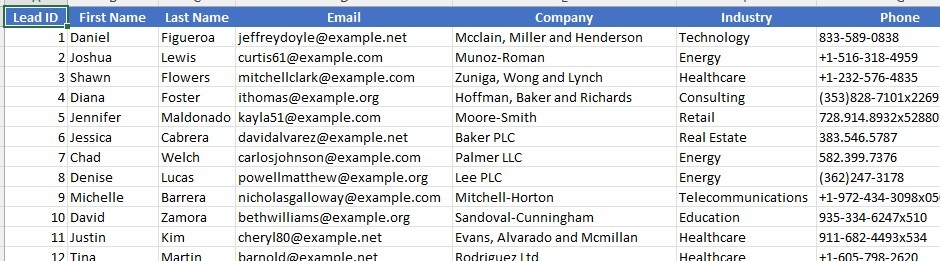
<p><code class="language-plaintext highlighter-rouge">lead_valuation_analysis.xlsx</code> has five sheets, and each one represents a stage of the funnel described earlier in this post — from raw leads down to a KPI summary. Here’s what you’ll find in each.</p>

<p><strong>Sheet 1: Input Leads</strong></p>

<p>This is the raw material: one row per lead, with fields like Lead ID, First Name, Last Name, Email, Company, Industry, Phone, City, State, Country, Annual Revenue, Employee Count, Lead Source, and Created Date.</p>

<p><img src="/assets/images/2026-07-22-leads.jpg" alt="Sample of the Input Leads sheet" /></p>

<p>In this demo, the leads are entirely synthetic — generated by the script, not scraped or collected from a real CRM. That’s deliberate: it keeps the demo self-contained and avoids using anyone’s real personal data. An SME analyst who wants to see their own numbers would replace this generation step with an export from their CRM or spreadsheet (same column structure), and everything downstream would run exactly the same way.</p>

<p><strong>Sheet 2: Validated Leads</strong></p>

<p>Before any lead is allowed into the funnel simulation, it’s checked against a set of data-quality rules enforced with <a href="https://docs.pydantic.dev/">Pydantic</a> — a Python library for validating that data matches an expected shape (e.g. is Email actually a valid email address, is Annual Revenue a positive number, is Employee Count a sensible integer, are required fields like Company or Industry actually populated). Records that fail validation are flagged or dropped rather than silently flowing into the funnel and quietly corrupting the KPIs downstream.</p>

<p>Because the leads on Sheet 1 were generated by the same script and already conform to those rules, Sheet 2 looks identical to Sheet 1 in this demo — nothing gets rejected. That’s a limitation of using synthetic data, not of the validation step itself. Point the pipeline at a real export from a CRM or a spreadsheet a sales rep has been editing by hand, and this sheet earns its keep: typos in email addresses, blank required fields, negative revenue figures, and duplicate lead IDs are exactly the kind of thing that creeps into real-world data and quietly skews conversion and CLV numbers if nothing catches them first.</p>

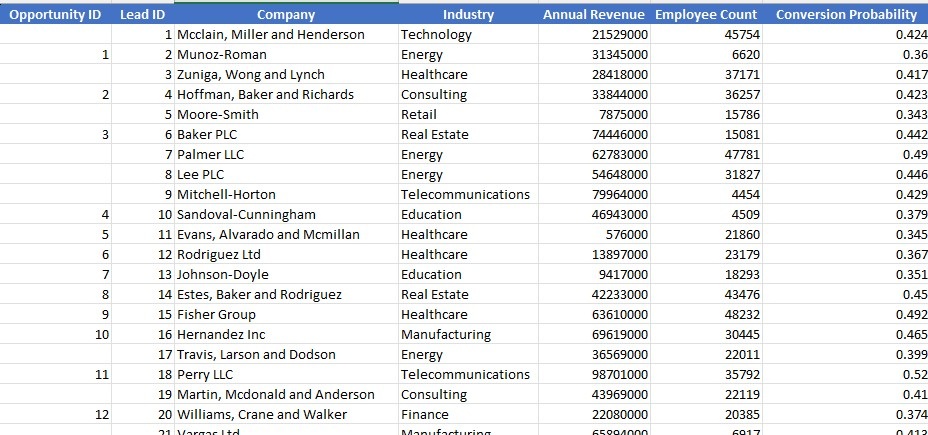
<p><strong>Sheet 3: Opportunities</strong></p>

<p>This sheet evaluates every lead from Sheet 1/2 and decides whether it progresses to become a sales opportunity — the first, and often hardest, conversion step in the funnel. Each row shows the Lead ID, Company, Industry, Annual Revenue, and Employee Count, alongside a randomly-assigned Conversion Probability and a resulting Conversion Status of either “Converted” or “Not Converted.” Only leads that converted are given a sequential Opportunity ID; the rest are left blank, since they never became an opportunity.</p>

<p><img src="/assets/images/2026-07-22-opportunities.jpg" alt="Sample of the Opportunities sheet" /></p>

<p>In this demo, whether a given lead converts is driven by a random conversion-rate assumption set in <code class="language-plaintext highlighter-rouge">config.py</code>, rather than any real signal about lead quality — it’s there to demonstrate the mechanics of the funnel, not to predict real outcomes. In a production setting, this is where you’d plug in an actual scoring model or historical conversion behavior instead of a random draw.</p>

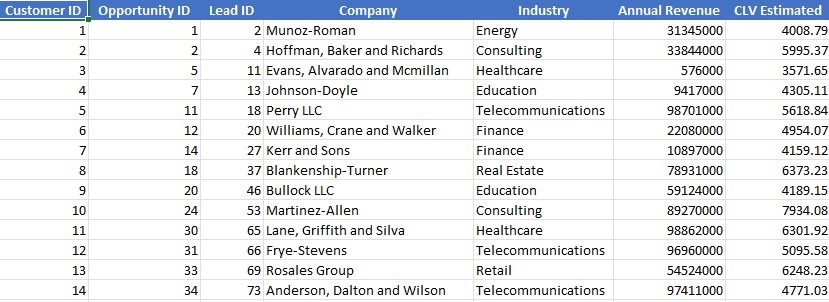
<p><strong>Sheet 4: Customers</strong></p>

<p>This is the narrowest part of the funnel: only opportunities that went on to close as paying customers appear here. Each row links back to its Opportunity ID and Lead ID, and adds a Customer ID, Company, Industry, Annual Revenue, and — the key new field — an <strong>Estimated CLV</strong> (Customer Lifetime Value), again generated from configurable assumptions in <code class="language-plaintext highlighter-rouge">config.py</code>.</p>

<p><img src="/assets/images/2026-07-22-customers.jpg" alt="Sample of the Customers sheet" /></p>

<p>This sheet is what ultimately feeds the CLV-based KPIs on the final sheet: it’s the small set of leads that survived the entire funnel, and what they’re estimated to be worth.</p>

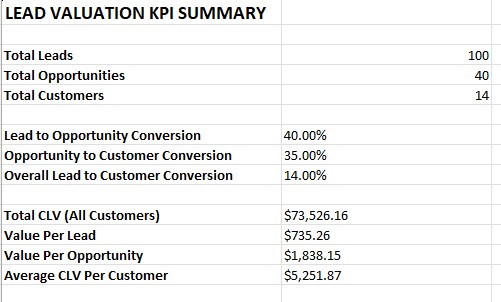
<p><strong>Sheet 5: KPI Summary</strong></p>

<p>The last sheet distills everything above into the numbers that actually matter for a business decision.</p>

<p><img src="/assets/images/2026-07-22-results.jpg" alt="Sample of the KPI Summary sheet" /></p>

<ul>
  <li><strong>Total Leads / Total Opportunities / Total Customers</strong> (100 / 40 / 14) — the raw funnel counts. On their own they don’t say much, but they’re the inputs for every ratio below.</li>
  <li><strong>Lead to Opportunity Conversion</strong> (40.00%) — of all leads generated, how many were judged worth pursuing as a real sales opportunity. This is largely a reflection of lead quality and how well marketing is targeting the right prospects. A low number here usually points to a targeting or messaging problem upstream, not a sales problem.</li>
  <li><strong>Opportunity to Customer Conversion</strong> (35.00%) — of the opportunities the sales team actually worked, how many closed. This is the metric most directly tied to sales execution: pitch quality, pricing, follow-up speed, and competitive positioning. A low number here is a sales-process problem, not a marketing one — useful for knowing <em>where</em> in the funnel to intervene.</li>
  <li><strong>Overall Lead to Customer Conversion</strong> (14.00%) — the end-to-end conversion rate, and the headline number for comparing performance across months or channels. It also lets you reverse-engineer targets: at 14%, generating 10 more customers requires roughly 70 more leads.</li>
  <li><strong>Total CLV (All Customers)</strong> ($73,526.16) — the total lifetime revenue expected from every customer this batch of leads produced. This is the real payoff figure for the whole funnel, not just a headcount of customers won.</li>
  <li><strong>Value Per Lead</strong> ($735.26) — the average lifetime value generated per lead, before any qualification happens. This is the number to compare directly against <strong>Cost Per Lead (CPL)</strong> for a given channel — if Google Ads costs $50 per lead and the average lead is worth $735, that channel is very likely worth the spend.</li>
  <li><strong>Value Per Opportunity</strong> ($1,838.15) — the average lifetime value once a lead has been qualified as an opportunity. Useful for deciding how much sales time is worth investing in working a given opportunity, or for a rough cost-per-opportunity break-even check.</li>
  <li><strong>Average CLV Per Customer</strong> ($5,251.87) — the expected lifetime revenue from a typical won customer. This is the ceiling for what a business can afford to spend acquiring a customer (<strong>CAC</strong>) and still come out ahead — the classic LTV:CAC ratio that investors and lenders often look for is built directly from this number.</li>
</ul>

<p>None of these numbers are meaningful in isolation — they only become useful once compared against real costs (CPL, CAC, sales team time) that live outside this demo. But they give an SME the same <em>shape</em> of analysis a much larger company would run, without needing a data team or an expensive BI tool to produce it.</p>]]></content><author><name>Matt Protopapas</name></author><summary type="html"><![CDATA[Why Lead Conversion &amp; Customer Lifetime Value Analytics Matter for SMEs]]></summary></entry><entry><title type="html">Can Artificial Intelligence Really Help Business Decisions</title><link href="https://mattprotopapas.github.io/2026/07/21/can-Artificial-Intelligence-really-help-business-decisions/" rel="alternate" type="text/html" title="Can Artificial Intelligence Really Help Business Decisions" /><published>2026-07-21T00:00:00+00:00</published><updated>2026-07-21T00:00:00+00:00</updated><id>https://mattprotopapas.github.io/2026/07/21/can-Artificial-Intelligence-really-help-business-decisions</id><content type="html" xml:base="https://mattprotopapas.github.io/2026/07/21/can-Artificial-Intelligence-really-help-business-decisions/"><![CDATA[<p>Generally speaking there are 3 kind of decisions: <em>strategic</em>, <em>tactical</em> and <em>operational</em> (day-to-day).</p>

<p>Data &amp; Analytics have been useful to all of them, but with a varying degree of value.</p>

<p>To explain these types of decisions, I’ll use an example from football.</p>

<p>Let’s suppose we have a football team.</p>

<p>The owners of the team have to make the long-term decisions that will impact the future of the team in the next season and beyond. Setting the vision of where they want the team to be several years from now, who to hire as a coach, what budget to allocate for players, etc. These are strategic decisions.</p>

<p>The coach of the team makes the tactical decisions. They decide which players to start with in the next game, if the team is going to play 4-4-2, 3-5-2, or whatever, they make substitutions during the game, etc. These decisions have a mid-term horizon.</p>

<p>The players make the operational decisions, during play. Whether to pass the ball, or dribble, how to position themselves in order to help the team score or defend, when to shoot, etc. These decisions are short-term (typically within a single phase of a match).</p>

<p>This of course is a simplified example. Where I come from, it is not uncommon to see the owner of the team dictating to the coach who he should select for starting in the next match, or even getting down to the pitch to complain to the referee for their decision. But that’s not necessary to consider for understanding data-driven decision making.</p>

<h3 id="so-in-which-types-of-decisions-have-data--analytics-provided-the-most">So in which types of decisions have Data &amp; Analytics provided the most?</h3>

<p>Actually it’s not strategic decisions as one might expect. While strategy has -by its definition- the most value as it determines to a large extend the future of the organization, setting a vision and making those complex decisions require more than simply analyzing data. So, while there are many pieces to the puzzle of strategic decision making, and most of them require a solid understanding of what’s involved - analytics provide a key impact there- it’s synthesis that makes a strategy. The decision makers must combine the insights from the data &amp; analytics regarding the current -and potential future- state of both the company and the market, with their deep understanding of the business landscape to set a realistic vision and set the broad guidelines to make it happen. So analytics, while being extremely helpful to analyze the individual elements of strategic decisions, play a supportive role to the overall decision making itself.</p>

<p>It is actually tactical decision making, where analytical models have played a key role. In all aspects of business management, be it Finance, Marketing or Operations, analytical tools exist to provide insights on what has happened, why, how things might evolve, and what would be the appropriate response of the business. Numerous examples exist: marketing mix &amp; customer acquisition / attribution / churn etc. models. Risk management, portfolio management, and financial models . Demand forecasting, inventory optimization, and production planning. And more…</p>

<p>In tactical decision making, data &amp; analytics can help the decision maker end-to-end, from understanding the current state of affairs and the root causes, to making near-optimal decisions.</p>

<p>When it comes to operational decision making, analytics always help. Fraud detection has always been useful for banks and credit card companies, next-best-action models have always helped customer service agents, and inventory monitoring has always been key on retaining customers while optimizing costs at the same time.</p>

<p>There are however, many simple operational decisions a company has to make, where the impact of analytics to the bottom line is limited, as the impact of such decisions is limited. Also, there might be easier ways to make good decisions on those matters, that do not require that much of analysis.</p>

<p>For example, understanding which orders have been invoiced does not necessarily require the construction of a data warehouse to consolidate all the data produced from all the company’s processes in all their systems. Neither they require advanced mathematical concepts. Reconciling information from their ERP and perhaps some other operational system, using simple business rules, would most probably do the trick.</p>

<h3 id="operational-decisions-are-easier-for-ai">Operational Decisions are easier for AI</h3>

<p>That’s why operational decisions have been either made automatically through code that incorporated a fixed set of business rules, or manually, from company employees who simply knew what needed to be done through their experience and training.</p>

<p>In my view, that’s where AI could offer its most potential. By simplifying the code that would be implemented to set up that automation, or to save employees time - who have definitely more productive and creative things to do, than reconciling invoices and order information.</p>

<p>They are also rather simple decisions, at least in comparison to the intricacies of tactical decisions, or even more, to the broader understanding and visionary capabilities required for strategic decision making.</p>

<p>We would expect (and need) to see some great business impact on the day-to-day company operations, from AI, for it to be considered a viable and useful tool to decision making.</p>

<p>There have been important successes in such grounds. Companies like Amazon and Netflix have been using recommendation engines for quite some time, to suggest items (and shows) of potential interest to their users. Companies like Uber have been experimenting with reinforcement learning for dynamic prices during surge times. And more..</p>

<h3 id="but-what-about-tactical-decisions">But what about tactical decisions?</h3>

<p>That’s where analytics have been providing the most value. And while many attempts have been made to delegate such decisions to AI bots, there are important problems.</p>

<p>First of all the AI bots and agents do not understand business context. The terminology, and information structure inherent in a company, has not been available in any LLM training set, as it is proprietary. To solve this problem, what is sometimes called a <em>semantic layer</em> is implemented, to ‘translate’ the business meaning to something the LLM’s can understand.</p>

<p>This has allowed us to create <em>Analytical AI chatbots</em> (and also agents) that can reply to analytical questions the decision makers make in natural language. This way, a stakeholder can ask ‘how many XYZ gadgets did we sell last month’ and get an accurate answer. Furthermore, this kind of bots &amp; agents can create visuals and perhaps even dashboards from a set of simple prompts, stated in natural language, from the company data.</p>

<p>However, we’re still not there, when it comes to complex thinking and decision making at a tactical level, directly from an AI agent.</p>

<h3 id="-productivity">… productivity?</h3>

<p>Another area where AI tools can help is on building analytical capabilities. Every data warehouse or pipeline that automatically populates it with data from source operational systems, is in effect, build using code. The same is true more or less for reports &amp; dashboards, and definitely for advanced analytics and machine learning models. AI can help a lot when building such analytical capabilities. Productivity increases of &gt; 10x are not uncommon.</p>

<h3 id="good-practices-are-paramount">Good practices are paramount</h3>

<p>We’re still in the early days of applied AI, and much is going to be done so that companies get a clear assessment of how AI tools can be effective and the business community to have a clear set of effective practices on leveraging AI to make better business decisions.</p>

<p>Some are already established. Even before the AI era. For example, data &amp; code quality control has always been important - even more important when our code is generated by an AI tool. The good news is that we can implement a series of diverse automatic tests (unit tests, integration tests, etc.) using AI tools to help us set up the code for these tests as well. The important thing is to follow a meaningful Software Development Process.</p>

<p>Another good practice that many practitioners agree, is that it’s better to use AI to write code for an analysis or a dashboard, instead of ‘asking it’ to do the analysis from scratch every time. This way you control the process better, you don’t risk by moving potentially sensitive information to the LLM servers (which might even be outside the continent), and you save money on tokens.</p>

<p>Another effective practice is to use the semantic layer I’ve mentioned when building AI chatbots that need to provide sensible answers to business questions. An LLM that directly refers to the underlying data model is generally not able to translate the business terms directly into SQL queries, by using only the information provided in a database schema. The results would be that the chatbot would not be able to provide an answer, or even worse, to hallucinate an answer that looks plausible but has no sense whatsoever.</p>

<p>We’ll all be following those trends - and some of us even affecting them - of course, as the potential value looks quite promising. But we should never forget the saying: ‘if you only have a hammer, everything looks like a nail’.</p>

<p>Effective decision making has always had to do with being able to distinguish fact from hype, value from loss, and opportunity from risk. And those have always been human qualities, and in business decisions an extensive amount of relevant expertise is essential.</p>]]></content><author><name>Matt Protopapas</name></author><summary type="html"><![CDATA[Generally speaking there are 3 kind of decisions: strategic, tactical and operational (day-to-day).]]></summary></entry><entry><title type="html">Welcome to the Matt Pro Analytics Blog</title><link href="https://mattprotopapas.github.io/2026/07/21/welcome-to-the-Matt-Pro-Analytics-blog/" rel="alternate" type="text/html" title="Welcome to the Matt Pro Analytics Blog" /><published>2026-07-21T00:00:00+00:00</published><updated>2026-07-21T00:00:00+00:00</updated><id>https://mattprotopapas.github.io/2026/07/21/welcome-to-the-Matt-Pro-Analytics-blog</id><content type="html" xml:base="https://mattprotopapas.github.io/2026/07/21/welcome-to-the-Matt-Pro-Analytics-blog/"><![CDATA[<p>This is the first post on <strong>The Matt Pro Analytics Blog</strong> — a place for detailed posts on how AI &amp; Analytics can help companies make data-driven decisions.</p>

<p>More posts are on the way, covering things like:</p>

<ul>
  <li>How AI tools can augment analytical capabilities</li>
  <li>Specific use cases of analytics on important business processes</li>
  <li>How SMEs can use their data to make better decisions, in the same way large corporates do</li>
  <li>Technical guidelines on how to implement modern Data &amp; Analytics data repositories.</li>
  <li>Data Management : Data Governance, Quality, etc.</li>
</ul>

<p>Check back soon, or subscribe via the <a href="/feed.xml">RSS feed</a>.</p>]]></content><author><name>Matt Protopapas</name></author><category term="analytics" /><category term="data" /><category term="AI" /><summary type="html"><![CDATA[This is the first post on The Matt Pro Analytics Blog — a place for detailed posts on how AI &amp; Analytics can help companies make data-driven decisions.]]></summary></entry></feed>