Ask the owner of a small distribution business how good their delivery service is and the answer is usually a feeling: “pretty good,” “we get the odd complaint,” “the carrier has been a bit slow lately.” Ask the customer the same question and you get a different, much more specific answer — because the customer remembers the order that arrived four days late, and the one that arrived on time but with half the quantity, and doesn’t much care which was the warehouse’s fault and which was the carrier’s.
Earlier posts on this blog looked at stock from the inside: how much to order and when, and how much working capital it’s reasonable to tie up in it. This post looks at the same operation from the customer’s side of the fence. On-Time In-Full (OTIF) is the supply chain industry’s standard answer to the question “did the customer get what they were promised, when they were promised it?” — and, together with a handful of related warehouse and third-party-logistics (3PL) KPIs, it turns “the carrier has been a bit slow lately” into “carrier X delivered 77.6% of its lines on time against a 91.4% target, costing us €494k of late-delivered orders, mostly out of the São Paulo site.”
For a small or medium-sized company, this matters more than it does for a large one, not less. A large retailer imposes OTIF penalties on its suppliers — the famous Walmart-style chargebacks — precisely because it can measure it. An SME that supplies those retailers is being measured whether it measures itself or not. And an SME that outsources warehousing or transport to a 3PL is usually paying for a contractual service level it has no independent way of verifying: the 3PL’s monthly report says 96% on-time, the sales team says customers are complaining, and nobody has the data to settle it.
The traditional way this gets handled at a small company is reactive: count complaints, chase the loudest customer’s order, phone the carrier. What’s missing is the same thing that was missing in the inventory posts — a number, at the right grain, against a target, that says where the service is failing, why, how much it’s costing, and whether it’s getting better or worse.
What OTIF and 3PL analytics actually give you
| Benefit | Why it matters for an SME |
|---|---|
| Measures service the way the customer experiences it | OTIF is measured per order line: an order of five lines that ships four complete and one short is 80% OTIF, not “delivered.” That is the number the customer’s receiving dock sees. |
| Separates the warehouse’s problem from the carrier’s | On-Time Shipping (did it leave the dock on time?) sits alongside On-Time Delivery (did it arrive on time?). If the first is fine and the second isn’t, it’s a transport problem — and you can stop blaming the pickers. |
| Puts money on every miss | Every failed line carries a value at risk — the value never delivered plus the value that arrived late — so the loss report ranks problems by what they cost, not by how often they happen. |
| Points effort at the few causes that matter | A Pareto of losses by root cause typically shows three or four causes driving 70–80% of the value at risk. That’s where the next month’s management attention goes. |
| Holds the 3PL to its contract, with your data | A carrier scorecard — on-time rate, days late, damage rate, documentation compliance — against the agreed target, computed from your order data, is the difference between a review meeting and an argument. |
| Connects inbound problems to outbound misses | Slow dock-to-stock, late supplier arrivals, and inaccurate stock records show up downstream as stockouts and short shipments. Measuring both ends makes the chain visible. |
| Shows the trend, not just the snapshot | Month-by-month OTIF against target, per site, distinguishes “one bad month” from “this warehouse has been off target for a year.” |
| Bad data never reaches the scorecard | A validation layer rejects order lines with impossible quantities, deliveries dated before shipments, unknown SKUs and duplicate records — with a stated reason — so the KPIs are computed from data you can defend. |
A practical example, using this repo’s own results
This repository — OTIF-3PL-Demo — ships with a full worked example. The scenario is a fictitious distributor of construction tools and consumables (anchors, drills, grinders, safety equipment), shipping from six warehouses — Atlanta, Dallas, São Paulo, Munich, Rotterdam and Singapore — through five 3PL carriers, over twelve months. The demo generates 870 sales orders (1,802 order lines), plus 400 inbound receipts and 700 cycle counts, the way this data usually arrives from a WMS, TMS or ERP: as five separate flat files. Each warehouse gets its own performance profile and each carrier shifts the on-time probability of the lines it carries, so the results have a real story in them rather than uniform noise. And, as in the earlier demos, a small percentage of rows are deliberately corrupted so the validation step has something real to catch.
The validation step rejected 214 of the 2,954 raw rows (7.2%), each with a stated reason — negative quantities, deliveries dated before the shipment left, delivered quantities greater than shipped, unknown root-cause codes, duplicate keys, and order lines pointing at SKUs that had themselves been rejected from the product master. That last case is worth noticing: master-data errors cascade. Three bad product records took 94 order lines down with them, exactly as would happen in a real data load. What remained was 1,660 clean order lines, and this is what the executive summary computed from them looks like:
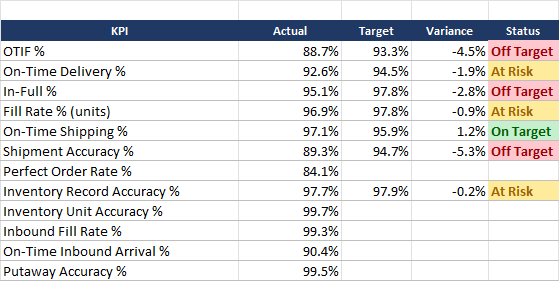
Read top to bottom, the sheet tells a coherent story before you open any other tab:
- OTIF is 88.7% against a 93.3% target — 4.5 points off. Roughly one order line in nine failed the customer’s promise.
- On-Time Shipping is 97.1%, above its 95.9% target, but On-Time Delivery is 92.6%. The warehouses are getting goods out of the door on time; the goods are arriving late anyway. That gap is the carriers’.
- In-Full (95.1%) is further off its target than Fill Rate (96.9%). In-Full counts lines; Fill Rate counts units. When the line-based measure is worse, the short shipments are many small ones rather than a few large ones.
- Shipment Accuracy — every line on the shipment left complete and on plan — is only 89.3%. Even a warehouse that ships on time is frequently shipping incomplete.
- Perfect Order Rate is 84.1%. Add damage-free and documentation-complete to OTIF and one order line in six had something wrong with it.
- The inbound side is largely healthy: inventory record accuracy 97.7%, putaway accuracy 99.5%, inbound fill rate 99.3%, dock-to-stock on target. The problem is not receiving.
Where the misses are: by warehouse and by carrier
The network number hides enormous variation between sites, which is the whole point of measuring per warehouse:

No warehouse meets its OTIF target, but they miss it in very different ways. Rotterdam is essentially there (94.8% against 95.0%, flagged At Risk). São Paulo is at 74.7% against an 88% target — 13 points off — and is one of only two sites (with Singapore) that is also off target on On-Time Shipping (90.9%). Three sites tell a subtler story: Atlanta and Munich are on target for on-time delivery (96.6% and 96.1%) yet still miss OTIF, because their in-full rates are 94.6% and 96.1%: their problem is availability, not speed. Singapore, on the other hand, is fine on in-full (98.0%) and badly off on on-time (86.6%): its problem is transport.
Which brings us to the carriers:

The scorecard ranks the five 3PLs by OTIF against a volume-weighted target of the warehouses each one serves — a carrier that serves only the harder lanes gets a fairer target than one serving only Europe. Nordwind Freight and Meridian 3PL hit their on-time targets. PacRim Forwarding, serving the two Asia-Pacific and Latin-America sites, delivered 77.6% of its lines on time against a 91.4% target, with 35 late lines and €494k of value delivered late — the largest of any carrier despite carrying the fewest lines. Two carriers in the middle, Atlas and Cascade, are within two points of their on-time targets — merely At Risk — yet between them account for €716k delivered late (€264k and €452k), because they carry more than five times PacRim’s line volume and a small percentage of a large volume is still a lot of money. That’s exactly the kind of thing a scorecard sorted by rate alone would have hidden.
Why: the root cause Pareto
Every one of the 187 failed order lines carries a root cause and a value at risk. Ranked:
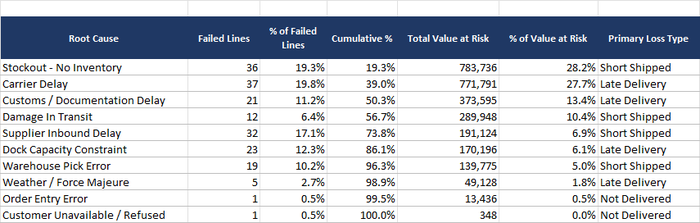
Two causes — stockouts (€784k) and carrier delays (€772k) — account for 56% of the value at risk between them, and they are different problems with different owners. Add customs and documentation delays (€374k) and damage in transit (€290k) and four causes explain 80% of the money. The remaining six causes — supplier inbound delays, dock capacity, pick errors, weather, order entry, customer refusals — share the last 20%.
The cross-tab against warehouse (further down the same tab) sharpens it further:
- São Paulo owns 61 of the 187 failed lines — a third of the network’s losses from 15% of its volume. Its failures are dominated by dock capacity constraints (13 of the network’s 23), customs delays (9 of 21) and supplier inbound delays (11 of 32). The Receiving Efficiency tab confirms it: dock-to-stock 24.2 hours against a 20-hour target, only 75.6% of inbound trucks arriving on time, and inventory record accuracy of 90.8% against a 96% target. The site is drowning on the inbound side and it is showing up as outbound misses.
- Atlanta has the network’s best on-time delivery and its worst stockout count (12 of 36). Its OTIF gap is entirely an availability problem — which is a purchasing and replenishment conversation, not a warehouse or carrier one.
- On the product side, a single SKU — a cut-protection glove — sits at 60.6% OTIF against a 90% target, 310 units short, €436k of value never delivered: over a third of the network’s total not-delivered value, from one item, due to stockout.
And over time: is it getting better?
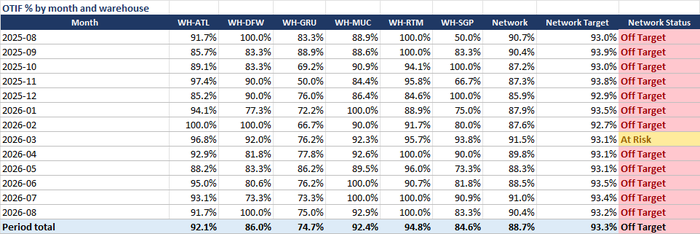
Bucketed by the month the delivery was promised (not the month it was ordered — so a miss lands in the period the commitment was due), the network sat between 85.9% and 91.5% every month, and climbed out of Off Target into At Risk exactly once (March 2026). This is not one bad month; it is a structural gap of roughly four to five points, twelve months running. São Paulo has not reached 90% in any single month. Rotterdam, by contrast, has posted 100% in five of thirteen months. The trend view is what tells you that fixing the network number means fixing São Paulo and the Asia-Pacific carrier, not sending a motivational email to everyone.
The business impact, in real numbers
Put a cost on what the workbook found:
- €2.78 million of orders did not arrive as promised in twelve months — €1.25M never delivered (1,570 units short) and €1.53M delivered late, an average of 8.2 days late. The first is revenue at direct risk; the second is revenue at risk of chargebacks, expedite fees, and quietly eroding customer relationships. On total shipped value that’s roughly one euro in eleven.
- Closing the 4.5-point OTIF gap is a concrete, bounded task. Four causes explain 80% of the loss; one warehouse explains a third of the failed lines; one carrier and one SKU each explain outsized shares of the late and short value. A small company cannot fix everything — but it can renegotiate or re-tender one carrier lane, put safety stock on one glove SKU, and send someone to look at one dock.
- The 3PL conversation changes. “Your service has been slow” is an opinion. “Your on-time rate on our Asia-Pacific lanes is 77.6% against the 91.4% in the contract, max 24 days late, €494k of our customers’ orders delivered late this year” is a scorecard — and the same scorecard shows two carriers meeting target, which is what makes the comparison fair.
- The data-quality dividend. 7.2% of the raw rows were unusable and every one was rejected with a reason, including the cascade from three bad product records. A scorecard used to withhold payment from a 3PL had better be computed from data that would survive the 3PL’s scrutiny.
What to actually do with this, this week
- Get the order-line grain. Export the last six to twelve months of order lines from your ERP or WMS with, at minimum: order and line ID, SKU, warehouse, carrier, quantity ordered / shipped / delivered, promised and actual ship dates, promised and actual delivery dates. If your system doesn’t capture actual delivery date, that is finding number one — you cannot measure OTIF without it, and your 3PL has it.
- Agree the definitions before you compute a number. How many days of grace count as “on time”? (The demo allows 2; many contracts allow 0.) Is a partial delivery a miss? (Yes, if it’s an order line.) Write it down; put it on the KPI definitions tab.
- Run it through the pipeline below, or any BI tool, and look at three views first: the executive summary, the root-cause Pareto, and the carrier scorecard.
- Assign owners by cause, not by KPI. Stockouts go to purchasing and replenishment (the reorder-point post is the natural next step). Carrier delays go to the 3PL review. Dock capacity and dock-to-stock go to warehouse operations. Customs goes to whoever owns documentation.
- Re-run it monthly and watch the trend tab. The value of OTIF is not the first number; it is knowing, a month after each fix, whether the fix worked.
Try it yourself: a demo you can run in minutes
To make this concrete, OTIF-3PL-Demo is a small, self-contained, open-source Python pipeline. It:
- Generates five fake source datasets — a product master, per-warehouse targets, outbound order lines, inbound receipts and cycle counts — with warehouse- and carrier-specific performance profiles baked in, and a configurable share of deliberately corrupted rows.
- Validates every row of every file against a strict schema, including cross-field rules (a delivered quantity can’t exceed the shipped quantity; a delivery can’t precede its shipment) and referential rules (an order line must point at a real SKU and a real warehouse), and writes a rejection report with a reason for every dropped row.
- Computes the full OTIF and 3PL KPI set — per product, per warehouse, per carrier, per month, and against target — and writes it all into a single 18-tab Excel workbook with red / amber / green status on every comparison.
Downloading the code (no Git experience needed)
You don’t need to know Git or the command line to get the code onto your computer:
- Go to the repository: github.com/MattProtopapas/OTIF-3PL-Demo
- Click the green
<> Codebutton near the top of the page. - Click “Download ZIP” in the dropdown.
- Right-click the downloaded ZIP and choose “Extract All…“ to unzip it into a regular folder.
- Open that folder — that’s the project. Ask your AI tool of choice (I used Claude) to
set up a Python environment and install the dependencies listed in
requirements.txt— no coding experience required to get it running.
If you’re comfortable with Git,
git clone https://github.com/MattProtopapas/OTIF-3PL-Demo.git does the same thing in
one step.
Running the demo
The repository includes a full README.md, but the short version, from PowerShell
(requires Python 3.10+; no pandas, numpy or scipy needed — the aggregation is plain
standard library):
python -m venv .venv
.\.venv\Scripts\Activate.ps1
pip install -r requirements.txt

python generate_data.py --orders 900 --months 12 --error-rate 0.04 --seed 42   # step 1: five fake source files
python validate_data.py                                                         # step 2: schema, cross-field and referential checks
python analyze_otif.py                                                          # step 3: KPIs -> 18-tab Excel workbook
Then open output/otif_3pl_analysis.xlsx. With --seed 42 you’ll get exactly the
numbers quoted in this post; the workbook committed to the repository was produced the
same way, so you can also just browse it on GitHub without running anything.
Options worth playing with: --orders, --products, --receipts, --counts and
--months change the size and span of the dataset; --error-rate 0 gives a perfectly
clean dataset (and an empty validation report); a different --seed gives a different
story. One setting lives in otif_common.py rather than on the command line, because it
is a policy rather than a parameter: ON_TIME_TOLERANCE_DAYS, the grace window after
the promised date within which a delivery still counts as on time. The demo uses 2 days;
set it to 0 for the strict on-or-before measure many retail contracts specify, and watch
the on-time rate drop.
Every input and output path is defined in one place in otif_common.py, so once you’re
comfortable with the demo you can drop your own real extracts — matching the column
layouts there — into data/, skip generate_data.py entirely, and run
validate_data.py and analyze_otif.py straight on your own orders.
Note: the sample data shipped with this repo is synthetic and randomly generated, and this project is intended for educational and demonstration purposes only — see the repository’s Disclaimer & EULA for details. It’s a starting point for understanding how OTIF and 3PL performance measurement works, not a production logistics reporting system.
Understanding the results
The workbook — output/otif_3pl_analysis.xlsx — has 18 tabs, which sounds like a lot
until you notice they fall into four groups.
The inputs (five Source tabs). Each validated source dataset, exactly as the analysis read it. The one that matters most is the order lines — the OTIF grain:

One row per order line, with the customer, warehouse, carrier and SKU, the three
quantities (ordered, shipped, delivered), the four dates (promised and actual ship,
promised and actual delivery), and — for lines that failed — the loss type and root
cause. Everything else in the workbook is an aggregation of this table. In the demo the
loss type and root cause come from the generator; in real life the root cause is the one
field you will probably have to start capturing, typically as a reason code on the
claim or the customer-service ticket. Alongside the source tabs,
data/validation_report.txt lists every rejected row from every file and why.
The scorecards. Executive Summary (every headline KPI vs. target vs. status, plus volume, loss and callout blocks), KPIs by Warehouse, KPIs by Product (each SKU against its own OTIF target, worst first, with its primary root cause), 3PL Carrier Scorecard, Shipment Accuracy (planned vs. shipped-on-plan vs. late-or-short vs. missed, by warehouse and carrier), Receiving Efficiency (dock-to-stock, on-time arrival, inbound fill rate, putaway accuracy, units per labour hour) and Inventory Accuracy (record and unit accuracy by warehouse, plus the twenty SKUs with the largest variance value lined up against their outbound fill rate — the tab that connects counting errors to short shipments).
The trends. OTIF Trend by Warehouse — three month × warehouse matrices, for OTIF, On-Time and Fill Rate, each with network target and status per month — and Monthly Trend (Network), the full KPI set resolved month by month.
The losses. Losses & Root Cause (the Pareto, the loss-type split, and the root-cause × warehouse cross-tab), Loss Detail (every failed order line, worst value at risk first — the tab to hand to the person who has to go and fix things), and Line Detail, the full computed grain with every flag, which is what everything else adds up from.
The last tab, KPI Definitions, states how every number in the workbook is calculated. It is the least glamorous and the most important: the first thing a 3PL will do when shown a scorecard that costs them money is ask how “on time” was defined.
The limits worth keeping in mind
OTIF analytics, like every tool covered on this blog, is genuinely useful within real limits:
- The number is only as good as the promised date. A company that quotes generous delivery dates will post excellent OTIF while its customers wait. OTIF measures promise-keeping, not speed; pair it with order cycle time (the summary tab reports it: 6.7 days here) if speed is what the customer values.
- Root causes have to be captured to be analysed. The demo generates them; your systems probably don’t record them yet. A single reason-code field on the claim or service ticket is usually enough to start, and the Pareto is worth the effort of filling it in.
- Targets are a decision. The demo’s per-warehouse targets are illustrative. Real ones come from the customer’s contract, the 3PL’s SLA, or an honest read of what the lane can physically achieve — and a target nobody has agreed to is just a red cell.
- Attribution is approximate. A late delivery caused by a late dispatch is booked to the carrier’s on-time rate as well as the warehouse’s on-time shipping — which is exactly why the two are reported side by side rather than as one number.
- Twelve months of a few hundred lines per site is enough to see the pattern, and not enough to trust a single month’s cell. Munich’s fill rate of 69% in May 2026 is essentially one order line — 179 gloves ordered, 20 delivered — not a trend. Read the monthly cells with the volume in mind.
None of that diminishes the core value. The customer is already measuring you, whether through chargebacks or through the quiet decision to order elsewhere next time. The order data already exists in your systems. The KPIs have been standard in supply chain practice for decades. What OTIF analytics changes is who finds out first — and whether, when the 3PL review or the key-account meeting comes around, you walk in with an opinion or with a scorecard.