Every growing company eventually faces a stack of competing requests for capital: a new production line, a warehouse expansion, a fleet upgrade, an IT overhaul, a sustainability retrofit. Every sponsor believes their project deserves funding, and the case for each one is usually told through a story rather than a number — “this will modernize the plant,” “this is overdue,” “this department hasn’t had capex in years.” None of that is wrong, but none of it answers the one question that actually determines whether the project makes the company richer or poorer: does the money it returns, discounted for time and risk, exceed the money it costs?
Previous posts on this blog have made the same argument for stock data and investment portfolios: replace gut feel with a number, using data the company already collects. Capital budgeting — the corporate finance framework for the firm’s investment decision, “which real assets should we invest in?” (Brealey & Myers, Principles of Corporate Finance) — does exactly that for capex proposals. Instead of ranking projects by how compelling the story is, it ranks them by Net Present Value (NPV): the dollar value the project adds to the firm today, after discounting every future cash flow by the firm’s cost of capital.
What capital budgeting discipline actually gives you
| Benefit | Why it matters for SMEs |
|---|---|
| One objective ranking, not one per department | Every proposal — manufacturing equipment, a warehouse, a fleet, an R&D facility — is scored on the same NPV/IRR/payback basis, regardless of which department or how senior the sponsor is. |
| NPV as the single source of truth | The Accept/Reject line is drawn at NPV > 0, which directly measures value added to the firm — avoiding the classic trap of approving a project because it has an attractive IRR or a fast payback while it’s quietly value-destructive on a discounted basis. |
| Bad proposals never reach the capital plan | Negative budgets, cash-flow schedules that don’t match the project’s stated life, hurdle rates outside policy — a validation layer catches these before they can distort which projects get funded. |
| A visible audit trail for what got excluded, and why | Every rejected submission is logged with the specific reason it failed — useful the moment a sponsor asks “why wasn’t my project even considered.” |
| One artifact the room can actually use | A finance team doesn’t need a notebook or a database query to review results — a formatted, color-coded Excel workbook is one click away from an executive summary, the full ranked analysis, or the raw assumptions behind any single project. |
| Reproducible, so it can be re-run and defended | The same inputs always produce the same recommendations — a real requirement when a decision has to be re-run, diffed against last quarter, or handed to an auditor. |
For most SMEs, the second row is where this framework earns its keep fastest: a proposal with an eye-catching IRR or a short payback period feels like an easy yes, but neither number accounts for the size of the investment or its full useful life the way NPV does — and that gap is exactly where good-sounding projects that quietly destroy value tend to hide.
A practical example, using this repo’s own results
This repository — capital-budgeting — ships with a full worked example instead of a hypothetical one. Running it with the defaults simulates a finance team receiving 20 capital investment proposals — new equipment, warehouse expansions, fleet vehicles, IT infrastructure, R&D facilities, renewable energy installations, automation robotics — with 4 additional records deliberately broken to prove the validation step actually rejects bad data rather than silently accepting it.

Every proposal carries the inputs a real capital request would: sponsor, department, asset type, initial outlay, useful life, the firm’s hurdle rate (discount rate) for that project, a multi-year cash-flow forecast, and a salvage value at the end of its life. This is the raw material every downstream number in the workbook is calculated from.
Catching bad submissions before they reach the capital plan
Before any project is scored, every proposal is checked against a strict data contract: outlays must be positive, the cash-flow forecast must have exactly as many entries as the stated useful life, the asset type must be a recognized real-asset category, and the discount rate must fall within a sane policy range. Four records fail on purpose, to prove the check isn’t a no-op:

Each rejection carries the specific reason it failed — a negative outlay, a cash-flow array with 3 entries against a stated 6-year useful life, an asset type (“Cryptocurrency Mining Rig”) that isn’t on the firm’s approved list, and a discount rate of 85% that’s clearly a data-entry error rather than an actual hurdle rate. This mirrors exactly the role the Validation Summary tab played in the portfolio optimization demo: catch bad data before it can distort a decision, and keep a record of what was excluded and why, rather than quietly dropping it.
The full ranking — and the trap NPV is built to avoid
With 20 valid proposals in hand, the pipeline runs the standard capital budgeting criteria on each one — NPV, IRR, simple and discounted payback period, and the Profitability Index — and ranks every project by NPV:
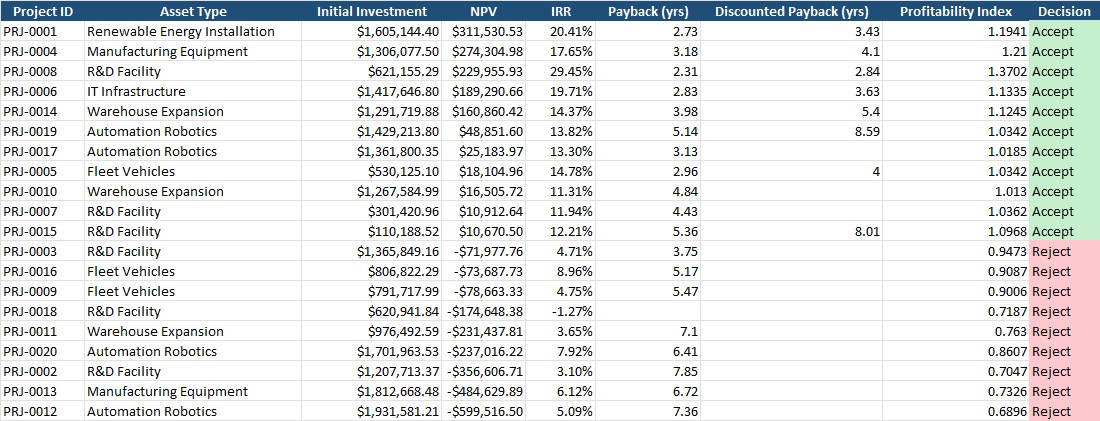
11 of the 20 valid proposals clear NPV > 0 and get an Accept; 9 don’t. Reading a few rows side by side shows exactly why NPV, not IRR or payback, is the deciding column:
| Project | Asset Type | Investment | NPV | IRR | Decision |
|---|---|---|---|---|---|
| PRJ-0001 | Renewable Energy Installation | $1,605,144.40 | $311,530.53 | 20.41% | Accept |
| PRJ-0008 | R&D Facility | $621,155.29 | $229,955.93 | 29.45% | Accept |
| PRJ-0012 | Automation Robotics | $1,931,581.21 | -$599,516.50 | 5.09% | Reject |
PRJ-0008 has the highest IRR of any project in the whole portfolio (29.45%) — a number that would win the room in most gut-feel discussions — but PRJ-0001 creates 35% more dollar value ($311,530.53 vs $229,955.93) because it’s a larger project earning a strong return, not just a small project earning a spectacular one. Ranking by IRR alone would have bumped the bigger value-creator down the list. And PRJ-0012 — the single largest investment request in the entire batch at $1.93M — is also its single worst outcome, destroying nearly $600K if funded. Size and quality of a proposal are, unsurprisingly, completely unrelated numbers.
There’s a subtler trap hiding in the Accept column too. PRJ-0017, PRJ-0010, and PRJ-0007 are all legitimate Accepts (NPV of $25,183.97, $16,505.72, and $10,912.64 respectively) — but all three show a blank Discounted Payback Period, meaning their discounted operating cash flows never fully recover the initial outlay within the project’s stated useful life. They only clear NPV > 0 because each carries a salvage value (5-9% of the initial outlay) realized in the project’s final year — a cash flow the NPV and Profitability Index calculations credit, but the payback calculations, by definition, don’t. These are the three lowest-NPV Accepts in the whole batch, and it’s not a coincidence: a project that barely clears the NPV hurdle and never technically pays back its own operating cash flows within its useful life is exactly the kind of marginal proposal that deserves a second look from a human before capital actually moves — a genuinely useful flag that a single “Accept/Reject” column, on its own, would hide.
The business impact, in real numbers
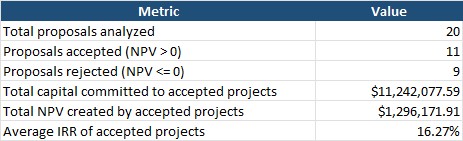
The headline numbers make the value of running this analysis at all concrete: $11.24 million committed to the 11 accepted projects, creating $1.30 million in NPV, at an average 16.27% IRR. But the more telling number is on the other side of the ledger. The 9 rejected proposals requested $11.22 million in capital — almost exactly as much as was approved — and if all nine had been funded anyway, on the strength of a good pitch or a short payback period, they would have collectively destroyed $2.31 million in value.
Put together: analyzing all 20 proposals against the same NPV bar, instead of funding whatever gets approved by seniority or momentum, is the difference between a +$1.30 million outcome and a swing of over $3.6 million relative to funding everything that was proposed. That’s the entire business case for running this analysis in one sentence — using nothing more than the numbers already sitting in the proposal intake.
What to actually do with this, this week
- Pull your next batch of capital requests into the same shape this repo uses — sponsor, department, asset type, initial outlay, useful life, hurdle rate, a cash-flow forecast, and any expected salvage value.
- Run it through this repo’s pipeline (or a similar tool), swapping the Faker-based
generator for your real intake —
capital_budgeting.pyandexcel_export.pydon’t care where the numbers came from. - Check the Rejected Records tab first. A mismatched cash-flow schedule or an out-of-policy hurdle rate is a more common submission error than it looks, and it will quietly skew a ranking if it isn’t caught.
- On the Analysis Results tab, don’t stop at the Decision column. Cross-check IRR against NPV for anything ranked highly on IRR alone (the PRJ-0008 pattern above), and check the Discounted Payback column for any Accept that’s blank or very close to the project’s useful life (the PRJ-0017/0010/0007 pattern) — both are legitimate flags for a second look, not analysis errors.
- Use the Executive Summary tab’s total NPV and total capital committed as the actual pitch to leadership for running this process at all — the “value avoided” side of the ledger is usually more persuasive than the “value created” side.
- Re-run this every capital planning cycle. A proposal’s cash-flow forecast and the firm’s cost of capital both drift; last year’s ranking isn’t this quarter’s ranking.
Try it yourself: a demo you can run in minutes
To make this concrete, this repository — capital-budgeting — is a small, self-contained, open-source demo. It:
- Generates (or accepts your own) capital investment proposals, using Faker for realistic synthetic data.
- Validates every proposal against pydantic data contracts — negative outlays, mismatched cash-flow arrays, unrecognized asset types, out-of-range hurdle rates — so bad submissions are rejected with a clear reason instead of silently corrupting the analysis.
- Runs the standard capital budgeting decision criteria on every valid proposal: NPV, IRR, payback period, discounted payback period, and Profitability Index.
- Writes everything — the raw proposals, the rejected records with reasons, the full ranked analysis, a year-by-year cash-flow detail, and an executive summary — into a single formatted Excel workbook.
Downloading the code (no Git experience needed)
You don’t need to know Git or the command line to get the code onto your computer:
- Go to the repository: github.com/MattProtopapas/capital-budgeting
- Click the green
<> Codebutton near the top of the page. - Click “Download ZIP” in the dropdown.
- Right-click the downloaded ZIP and choose “Extract All…“ to unzip it into a regular folder.
- Open that folder — that’s the project. Ask your AI tool of choice (I used Claude) to set
up a Python environment and install the dependencies listed in
requirements.txt— no coding experience required to get it running.
If you’re comfortable with Git, git clone https://github.com/MattProtopapas/capital-budgeting.git
does the same thing in one step.
Running the demo
The repository includes a full README.md, but the short version, from PowerShell:
python -m venv venv
.\venv\Scripts\Activate.ps1
pip install -r requirements.txt

python main.py
That default run generates 20 valid proposals plus 4 intentionally invalid ones and writes
capital_budgeting_analysis.xlsx. A handful of CLI options let you reshape the exercise
without touching any code:
| Flag | Default | Description |
|---|---|---|
--n-valid |
20 |
Number of valid synthetic proposals to generate |
--n-invalid |
4 |
Number of intentionally invalid records to inject (demonstrates validation) |
--seed |
42 |
Faker random seed, for reproducible runs |
--output |
capital_budgeting_analysis.xlsx |
Output Excel file path |
For example, a larger, differently-seeded batch of proposals:
python main.py --n-valid 50 --n-invalid 6 --seed 7 --output q3_capital_plan.xlsx
Note: the data generated by this demo is synthetic and randomly generated, and this project is intended for educational and demonstration purposes only — it is not financial or investment advice, and no capital allocation decision should be based solely on its output. See the repository’s Disclaimer & EULA for details. It’s a starting point for understanding how capital budgeting analysis works, not a production finance tool.
Understanding the results
capital_budgeting_analysis.xlsx has five tabs, each one a stage of the pipeline described
above: Executive Summary, Analysis Results, Project Proposals, Cash Flow Detail, and
Rejected Records — the four screenshots earlier in this post are pulled directly from the
Project Proposals, Rejected Records, Analysis Results, and Executive Summary tabs,
in that order. Cash Flow Detail isn’t pictured above because it’s a long-format,
year-by-year breakdown of every project’s cash flow (130 rows for this default run) — useful
for auditing a single project’s numbers, but not a tab you read top to bottom.
The limits worth keeping in mind
Capital budgeting analysis, like the inventory and portfolio tools covered in earlier posts, is a genuinely useful framework with real limits — and this project is upfront about them rather than hiding them:
- It’s only as good as the forecast. NPV, IRR, and every other metric here are only as reliable as the cash-flow projections and discount rate fed into them — a sponsor’s optimistic forecast produces an optimistic NPV, garbage in, garbage out.
- It assumes the discount rate is right. A single hurdle rate per project is a simplification; real firms sometimes adjust it for project-specific risk, and this demo takes the submitted rate at face value.
- NPV measures value, not everything that matters. Strategic fit, regulatory requirements, or a project that’s a prerequisite for another one aren’t in the objective function and need separate judgment — the same caveat that applied to the market basket rules and inventory reorder points from earlier posts.
- This is a demonstration, not financial advice. The output is a structured way to rank a given set of proposals against a given cost of capital — it isn’t a recommendation about what a specific company should actually build.
None of that makes the exercise less worthwhile. It just means the output of a capital budgeting run is an input to an investment committee’s decision, not the decision itself — in the same way the market basket rules and portfolio weights from earlier posts are inputs to a merchandising or allocation decision, not a replacement for judgment. Used that way, capital budgeting discipline turns “this project sounds like a good idea” into “here is exactly how much value this project adds, and here are eight other projects that would add more or less” — a genuinely useful upgrade for any SME’s capital planning cycle, using nothing more than the proposal data that’s already landing in someone’s inbox.