Ask the owner of a small shop, café or wholesaler how they set a price and the answer is usually one of two things: “cost plus forty percent,” or “a bit under what the place down the road charges.” Ask how they decide what to discount in the run-up to Christmas and the answer is vaguer still: “the ones that need a push,” “whatever the supplier is doing a deal on,” “twenty percent off always works.” Sometimes it does. But nobody in the building can say by how much volume goes up when the price comes down, which means nobody can say whether the discount made money or gave it away.
This blog keeps returning to the same idea: replace gut feel with a number. The market basket post found which products sell together; the lead conversion post measured what each stage of the funnel is worth; the demand forecasting post two weeks ago put a number, with an error bar, on what will sell next month. All of them took price as given. This post asks what the price should be. Price elasticity — a regression on the sales history the business already has, judged on contribution margin rather than revenue — turns “twenty percent off always works” into “a 20% markdown on this product needs a 73% lift in volume to break even, the history says it will get 102%, so it earns €961 a week; a 20% markdown on that one needs 509% and will get 99%, so it loses two-thirds of the product’s contribution.”
For a small or medium-sized company this matters more than for a large one, because the margin for error is thinner and the pricing team does not exist. A supermarket chain has revenue managers and software; an SME has a list price file, a till, and a person who knows the customers. The good news is that if that person has changed prices a few times over the past couple of years — and almost everyone has, through supplier increases, promotions and rounding — the data to estimate how customers reacted is already sitting in the sales export.
The traditional way this gets handled is by habit: prices follow cost, promotions follow the calendar, and the effect of either is judged by whether the month felt busy. What’s missing is a number per product that says how sensitive its customers actually are to price, how sure you can be of that, and what it implies for the next price rise and the next markdown.
What price elasticity actually gives you
| Benefit | Why it matters for an SME |
|---|---|
| One number per product for how demand reacts to price | The elasticity b is the slope of ln(units) = a + b × ln(price), fitted on each product’s weekly price and volume history. b = −1.5 means a 1% price cut lifts volume by about 1.5%. It needs nothing beyond the sales export. |
| A dividing line you can act on | Between 0 and −1 demand is inelastic: a price rise loses fewer units than it gains in margin, so contribution goes up. Below −1 it is elastic: volume reacts strongly, and the right move may be down. Unit elasticity (−1) is where revenue is flat. |
| An honest statement of how much to trust it | Standard error, t-statistic and R² are reported for every product. A product whose slope cannot be distinguished from zero is labelled Inconclusive, and one with too few price points or weeks is labelled Insufficient data — a candidate for a controlled price test, not a price change. |
| Every verdict is on contribution, not revenue | A promotion that lifts revenue can still lose money if the extra units carry too little margin. Everything in the workbook is judged on units × (price − unit cost). |
| The break-even lift for any discount | A markdown d on a product with price P and unit cost c needs a volume lift of (P − c) / (P(1 − d) − c) − 1 just to stand still. The expected lift from the elasticity is (1 − d)^b − 1. The promo pays only if the second number beats the first. |
| A target margin for elastic products | For elastic products the contribution-maximising margin is −1 / b (the Lerner rule). If the current margin is well above that, a permanent cut adds contribution; if it is well below, even an elastic product should go up. |
| Bad data never reaches the regression | A validation layer rejects negative costs, zero prices, unparseable dates, blank product codes, units that aren’t whole numbers and rows whose revenue doesn’t equal price × units, each with a stated reason. |
A practical example, using this repo’s own results
This repository — pricing-for-smes — ships with a full worked example. The scenario is a fictitious small retailer with 40 products across eight categories — coffee & tea, bakery, snacks, household, personal care, stationery, kitchenware and pet supplies — sold in-store and, for some lines, online, with two years (104 weeks) of weekly sales. Every product has a hidden true elasticity, and its history is built the way real histories are: a base price that moves two to four times over the two years, promotions in about one week in ten (one in four in November and December) at 10–30% off, a seasonal pattern shared by every product, and noise. The hidden truth is written to a separate file so you can check how well the analysis recovers it. And, as in the earlier demos, a small share of rows is deliberately corrupted so the validation step has something real to catch.
The raw sales file has 6,657 rows. The validator rejected 201 of them (3.0%), each with a stated reason: 39 with a unit cost of zero or less, 36 with a blank product code, 35 with dates that don’t exist, 33 whose revenue did not equal price × units, 30 whose units sold weren’t a whole number, 27 with a zero or negative price, and one duplicated transaction id. What remained is what every estimate in the workbook ran on:
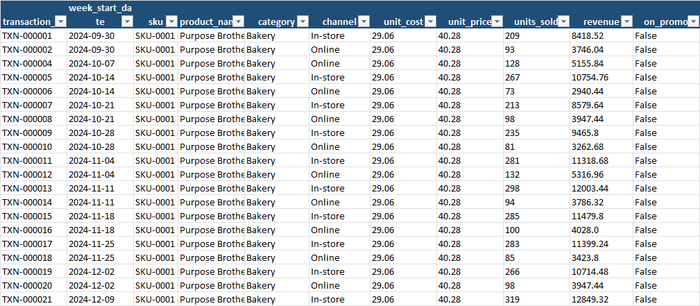
The pipeline collapses the two channels into one price/volume observation per product per week, divides each week’s units by a calendar-month index so that the November peak is not credited to the promotions that tend to run in it, fits the log-log regression per product, and classifies the result:
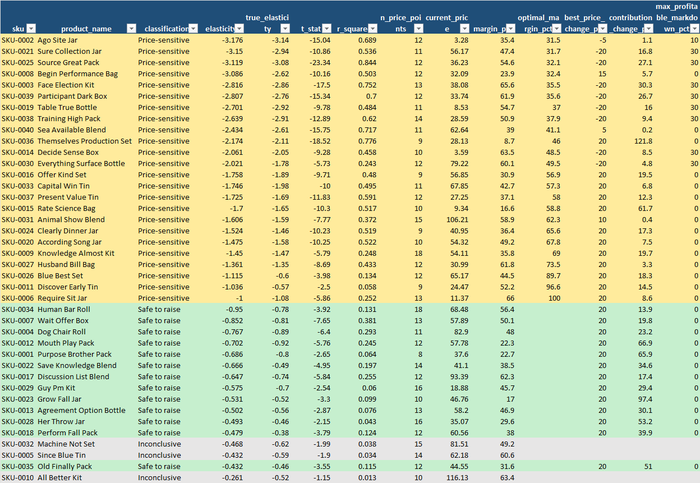
Read down the classification column and the sheet answers the question an SME owner actually has — which of my products can take a price rise, and which are the ones people compare? — before any of the detail:
- Thirteen products (green) are Safe to raise: their estimated elasticity sits between −0.43 and −0.95, and every simulated price increase adds contribution.
- Twenty-four (yellow) are Price-sensitive, with elasticities from −1.00 down to −3.18. Whether the right move for these is a discount or, surprisingly, a rise, depends on the current margin — more on that below.
- Three are Inconclusive (grey): Machine Not Set, Since Blue Tin and All Better Kit each have a t-statistic between −1.15 and −1.99, so the data cannot say whether their customers react to price at all. The right action is a deliberate price test, not a guess.
- None are Insufficient data, because two years of history gave every product at least eight distinct price points and 97 weeks with sales.
Because this is synthetic data, the workbook can also show how close the estimates got. Across all 40 products the estimated elasticity was within 0.14 of the true value on average (median 0.10), and 37 of 40 land on the same side of −1 as the truth. The three that don’t are instructive: Blue Best Set (estimated −1.12, true −0.60) and Discover Early Tin (estimated −1.04, true −0.57) both have an R² below 0.14 and are the two weakest fits on the Price-sensitive list, and Require Sit Jar sits at exactly −1.00 against a true −1.08. The lesson is the one the t-stat and R² columns are there to teach: a product whose fit is poor and whose slope hugs the boundary should be treated as borderline, whatever the label says.
What the regression is actually looking at
It helps to see the raw material. Plotted straight from the Input Data tab, here is every week of Source Great Pack — the product with the strongest fit in the range (R² 0.84, t-statistic −23) — with the price it sold at on the horizontal axis and the units it sold that week on the vertical:
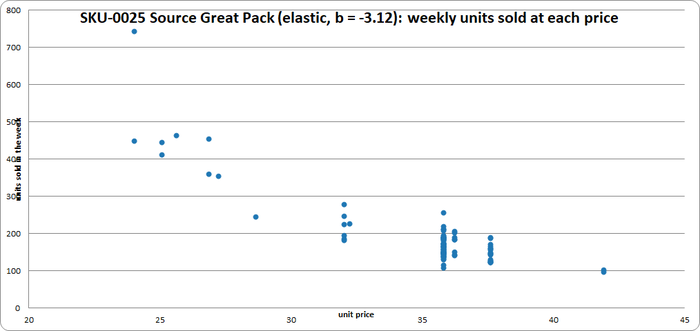
Twelve distinct price points between €24.02 and €41.90, and a curve any shopkeeper would recognise: at €24 it sold 400 to 740 units a week, at €36 to €38 it sold 100 to 250. The fitted elasticity is −3.12 (the hidden truth was −3.08). Compare Human Bar Roll, the Safe-to-raise product closest to the boundary:
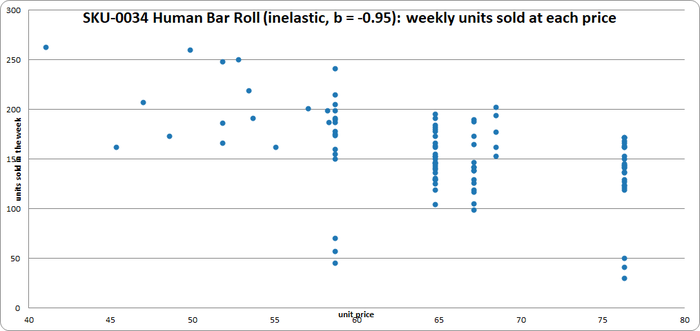
Eighteen price points between €41 and €76, and volume that drifts from roughly 200–260 a week down to about 150. The fitted elasticity is −0.95: customers notice, but not much. The scatter is also wider — the handful of weeks at 30–70 units at the same price as weeks of 150 — which is why its R² is 0.13 against 0.84 for Source Great Pack, and why it sits closer to the boundary than its label suggests.
Which products to put up, and by how much
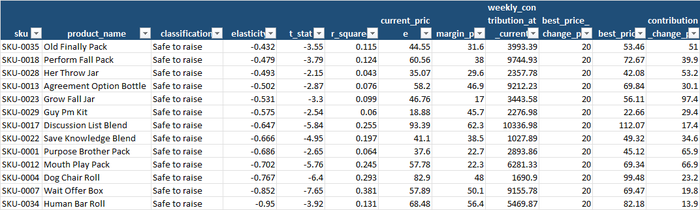
The thirteen Safe-to-raise products carry €67,900 a week of contribution between them at current prices. The Price Change Simulation tab reprices each of them at −20% to +20% in 5% steps and recomputes the expected units, revenue and contribution. Two things stand out.
The gain from a modest rise is large, and it comes from the thin-margin products. Putting all thirteen up by 5% adds 10.0% to their combined contribution — roughly €6,800 a week — and 10% adds 19.5%. Mouth Play Pack (elasticity −0.70) sells 487 units a week at €57.78 against a cost of €44.89, a margin of only 22%. A 5% rise costs it 3.4% of its volume and adds 18.3% to its contribution; a 10% rise adds 35.5%, because on a €12.89 margin an extra €5.78 of price is almost pure profit:
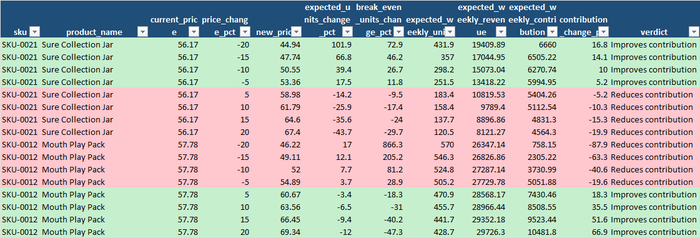
Human Bar Roll, by contrast, already earns a 56% margin and sits at −0.95; a 5% rise adds just 3.9%. The elasticity tells you which direction; the margin tells you how much it is worth.
The “best move” column stops at +20% because the simulation does, not because that is the right price. Constant elasticity means an inelastic product’s contribution keeps rising as far as you care to extrapolate, and the extrapolation is only trustworthy inside the range of prices actually observed. That is why the recommendation column says start with a +5–10% test and re-measure rather than raise by 20%.
Which discounts pay, and which give margin away
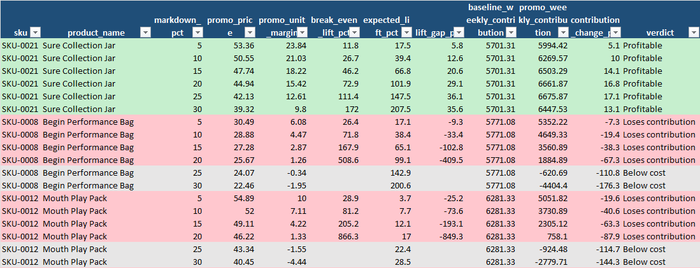
This is the tab to open before planning the holiday promotions. For each of the 37 products with a usable elasticity and each markdown from 5% to 30%, it shows the promo price, the unit margin left, the lift the discount needs to break even, the lift the elasticity says it will get, and the contribution before and after. Of the 222 scenarios, 50 add contribution, 154 lose it, and 18 take the product below cost. Only nine of the 37 products have any markdown depth that pays. The three products in the screenshot are the three cases you will meet in your own range:
Elastic and well-margined: the discount earns its keep. Sure Collection Jar (elasticity −3.15, margin 47%) needs a 72.9% lift to break even on a 20% markdown and is expected to get 101.9%; contribution goes from €5,701 a week to €6,662 (+16.8%). The gain peaks at 25% off (+17.1%) and starts to fall at 30%, because by then the remaining €9.80 of unit margin needs a 172% lift and the elasticity only delivers 208%. The tab tells you not just whether to discount but how deep.
Elastic but thin-margined: the discount loses money anyway. Begin Performance Bag has almost the same elasticity (−3.09) but a 24% margin. Even a 5% markdown needs a 26.4% lift and will get 17.1%, so contribution falls 7.3%; at 20% off it falls 67%; at 25% the promo price is below cost. Customers are price-sensitive — that is exactly why the extra volume cannot cover the margin given away. Its best move is actually a 15% rise (+5.7%).
Inelastic: keep it off the promo list altogether. Mouth Play Pack needs an 866% lift to break even on a 20% markdown and will get 17%. Discounting an inelastic product is paying customers who were going to buy anyway.
That last pattern is more common than the classification suggests. Of the 24 Price-sensitive products, fifteen have a rise as their best simulated move, because their current margin is below the Lerner optimum for their elasticity. Themselves Production Set is the extreme case: elasticity −2.17, but a price of €28.13 against a cost of €25.68 — an 8.7% margin where the rule says 46%. A 20% rise loses a third of its volume and more than doubles its contribution (+121.8%). “Price-sensitive” is a statement about customers; whether to cut is a statement about margin.
The business impact, in real numbers
Put a cost on what the workbook found:
- Thirteen products can take a 5% rise and add about €6,800 a week of contribution between them — with the thin-margin ones doing most of the work: Mouth Play Pack (+€1,150 a week, +18%), Perform Fall Pack (+€1,030) and Grow Fall Jar (+€900, +26%) account for nearly half. Done as a +5–10% test on the strongest fits first, that is a few weeks’ work.
- Only nine of 37 products have any discount depth that pays. A holiday campaign that marked down the “usual” list would, on this data, lose contribution on roughly three products in four. Eight of the nine that pay — Sure Collection Jar, Source Great Pack, Face Election Kit, Participant Dark Box and four others — can go to 30% off and still come out ahead; the ninth, Ago Site Jar, only to 10%.
- The most price-sensitive products are not necessarily the ones to discount. Begin Performance Bag is the fourth most elastic product in the range and loses money at any markdown. Fifteen of the 24 elastic products should go up.
- Three products should not be touched until a controlled test has been run, and two more sit close enough to the boundary, with weak enough fits, to be treated the same way. The t-stat and R² columns exist to stop a confident-looking number from becoming a confident-looking mistake.
- The data-quality dividend. Three percent of the raw rows were unusable — a regression run on a file with revenue that doesn’t match price × units and dates in month 13 gives a slope that looks just as precise and means nothing.
What to actually do with this, this week
- Export weekly sales by product for the last two years: product, week, unit price actually charged, units sold, unit cost, and a flag for promotion weeks. If prices only exist on the invoice lines, derive the weekly price as revenue ÷ units. Two years is enough for most products to have seen three or more distinct prices; if a product has only ever had one price, the method has nothing to work with and a small deliberate test is the only way to learn.
- Run the pipeline and start on the Inconclusive and Insufficient rows. These are the products you know least about. Pick the highest-volume ones and plan a 5% price test for a month, so that next quarter they have data.
- Take the Safe-to-raise list, sort by fit quality, and raise the top three to five by 5–10%. Watch weekly units for four to six weeks and compare with the simulation’s expected volume change. If the volume held, take the next tranche.
- Take the holiday promotion plan and cross it against the Promo Scenarios tab. Anything with a negative lift gap comes off the list or gets a shallower depth. Anything on the Safe-to-raise list comes off the list, full stop.
- Re-run quarterly. Every price change and every promotion adds a data point, and the estimates get sharper. A product whose elasticity moves a lot between runs is telling you something changed — a competitor, a substitute, a shift in who buys it.
Try it yourself: a demo you can run in minutes
To make this concrete, pricing-for-smes is a small, self-contained, open-source Python pipeline. It:
- Generates a fake product range, each product with a hidden true elasticity, and two years of weekly sales per product and channel across several list-price changes and random promotions, with seasonality and noise, plus a configurable share of deliberately corrupted rows.
- Validates every row against a strict schema — including the rule that revenue must equal price × units — drops duplicates, and writes a rejection report with a reason for every dropped row.
- Deseasonalises the weekly volumes, fits the log-log regression per product, classifies each one, and writes everything into a single 7-tab Excel workbook — the elasticities, the two action lists, the promotion scenarios, the price-change simulation and a plain-language notes tab.
Downloading the code (no Git experience needed)
You don’t need to know Git or the command line to get the code onto your computer:
- Go to the repository: github.com/MattProtopapas/pricing-for-smes
- Click the green
<> Codebutton near the top of the page. - Click “Download ZIP” in the dropdown.
- Right-click the downloaded ZIP and choose “Extract All…“ to unzip it into a regular folder.
- Open that folder — that’s the project. Ask your AI tool of choice (I used Claude) to
set up a Python environment and install the dependencies listed in
requirements.txt— no coding experience required to get it running.
If you’re comfortable with Git,
git clone https://github.com/MattProtopapas/pricing-for-smes.git does the same thing in
one step.
Running the demo
The repository includes a full README.md, but the short version, from PowerShell
(requires Python 3.10+; the regression is plain ordinary least squares written with the
standard library’s math and statistics modules — no numpy, scipy or pandas needed, so
you can read exactly what is being fitted):
python -m venv .venv
.\.venv\Scripts\Activate.ps1
pip install -r requirements.txt

python generate_data.py --products 40 --weeks 104 --seed 42   # step 1: fake products + weekly sales, hidden true elasticities
python validate_data.py                                       # step 2: schema checks, rejection report
python analyze_pricing.py                                     # step 3: elasticity, margin impact, promo scenarios -> 7-tab Excel workbook
Then open output/pricing_analysis.xlsx. With --seed 42 you’ll get exactly the numbers
quoted in this post; the workbook committed to the repository was produced the same way,
so you can also just browse it on GitHub without running anything. (One caveat, as with
the forecasting demo: the generator dates the history to end on the most recent Monday,
so if you run it later than the week this post was written the weeks will be labelled
differently — the products, prices and every estimate will be the same.)
Options worth playing with: --products and --weeks change the size of the dataset;
--error-rate 0 gives a perfectly clean file (and an empty validation report); a
different --seed gives a different range and a different story. The analysis thresholds
live at the top of pricing_common.py rather than on the command line, because they are
policy rather than parameters: MIN_PRICE_POINTS (3) and MIN_OBSERVATIONS (12 weeks)
before a regression is attempted at all, MIN_ABS_T_STAT (2.0) before it is believed,
the PROMO_DEPTHS (5–30%) tabulated on the scenario sheet and the PRICE_CHANGE_STEPS
(±20%) in the simulation.
Every input and output path is defined in one place in pricing_common.py, so once
you’re comfortable with the demo you can drop your own weekly sales export — matching the
column layout there — into data/, skip generate_data.py entirely, and run
validate_data.py and analyze_pricing.py straight on your own products.
Note: the sample data shipped with this repo is synthetic and randomly generated, and this project is intended for educational and demonstration purposes only — see the repository’s Disclaimer & EULA for details. It’s a starting point for understanding how price elasticity and contribution-based promotion analysis work, not a pricing system.
Understanding the results
The workbook — output/pricing_analysis.xlsx — has seven tabs, in the order you should
read them.
The input. Input Data is the validated sales history exactly as the regression read
it — one row per product, week and channel, with cost, price, units, revenue and the
promotion flag. Alongside it, data/validation_report.txt lists every rejected row and
why.
The scorecard. Elasticity by Product — one row per product with the estimated elasticity (and, because this is a demo, the hidden true one beside it), its standard error, t-statistic and R², the number of weeks and distinct price points the fit is based on, the observed price range, the current list price, unit cost and margin, the Lerner optimal margin for elastic products, the best price move within ±20% and what it does to contribution, the deepest profitable markdown, and a one-line recommendation. Price-sensitive rows are shaded yellow, Safe-to-raise green, Inconclusive grey. Safe to Raise and Price Sensitive are the same rows filtered into the two action lists.
The decisions. Promo Scenarios — one row per product and markdown depth, with the break-even lift, the expected lift, the gap between them, and the contribution before and after; Profitable, Loses contribution or Below cost. It is the one tab to hand to whoever plans the promotions. Price Change Simulation is the same idea for permanent moves from −20% to +20%: expected units, revenue and contribution at each step.
The explanation. Method Notes explains every column in plain language, including the formulas, so the workbook can be handed to someone who has not read this post.
The limits worth keeping in mind
Elasticity estimation, like every tool covered on this blog, is genuinely useful within real limits:
- It only sees the prices you have actually charged. Between €24 and €42, the model
for Source Great Pack is well supported; at €20 or €50 it is a guess. Never
extrapolate beyond the
min_price–max_pricecolumns, and treat the +20% edge of the simulation as a boundary of the data, not a recommendation. - Constant elasticity is an approximation. Real demand curves bend: the first 5% rise may cost little and the next 5% a lot. That is another reason to move in small steps and re-measure rather than jump to the simulated optimum.
- The history contains things the model cannot see. Competitor moves, stock-outs, shelf position, a new listing on a marketplace, and the promotions of other products all move volume and get attributed to price. The month index removes shared seasonality; it does not remove the week your competitor ran out.
- Promotions carry effects the elasticity alone doesn’t capture. A discount can pull purchases forward from next month, train customers to wait for the next one, or bring in new customers who stay. The break-even lift is the right first question, not the last.
- Costs move too. Every verdict depends on the unit cost column. If the supplier price has changed since the history was recorded, update it before reading the promo sheet — a thin margin can become a negative one.
- The demo’s products are simple. Real ranges have substitutes and complements: put up the coffee and the sales of filters move too. The market basket post is the place to find those pairs before pricing them independently.
None of that diminishes the core value of this approach. The sales history already exists. The method is the one Alfred Marshall wrote down in 1890, and it runs in seconds on a laptop. What elasticity changes is not that you know the perfect price, but that you know, product by product, which way to move it, how far the data supports going, and which discounts are generosity to customers who would have paid full price anyway.