Most companies with more than a spreadsheet’s worth of customers already have everything they need to answer “who are our best customers, and who’s about to leave?” — a customer ID, a signup date, a channel, a purchase count, a total spent. What’s usually missing isn’t the data, it’s the step that turns a flat customer list into groups a marketing or retention team can actually act on. Without that step, every customer gets the same email, the same discount, the same win-back offer — and the offer that would have worked on a lapsing big-spender gets wasted on someone who was never going to buy again anyway.
Previous posts on this blog have made the same argument for transaction baskets, investment portfolios, and capital proposals: replace gut feel with a number, using data the company already collects. Customer profiling and segmentation does that for the customer base itself — turning “we think our regulars matter most” into a ranked, quantified answer of exactly which customers are worth protecting, which are worth chasing, and which have already gone quiet.
What profiling and segmentation actually give you
| Benefit | Why it matters |
|---|---|
| Sharper marketing spend | Target “Champions” and “Loyal Customers” with loyalty or referral offers instead of a blanket discount everyone gets regardless of value. |
| Earlier churn warnings | Recency — days since last purchase — is an early-warning signal on its own. A customer who used to buy often and has gone quiet is a very different, more urgent target than one who never really engaged. |
| Better product and channel decisions | Knowing the demographic and channel mix of your highest-value segment tells you where to invest in product, UX, and support. |
| More efficient acquisition | Profiling your best existing customers — age, geography, channel, spend pattern — gives you a template for who to prospect next, instead of acquiring broadly and hoping. |
| A shared vocabulary across teams | A documented segmentation means “Champions” means the same thing in marketing’s deck, sales’ pipeline, and finance’s forecast, instead of every team inventing its own ad hoc buckets. |
| Trustworthy inputs, not just trustworthy math | Segmentation built on dirty data — impossible ages, negative spend, malformed emails — produces confidently wrong answers. Validating before analyzing is what makes the resulting segments worth acting on. |
For most companies, the second row is where this pays off fastest: recency is the cheapest signal to collect and the one most people never look at, yet it’s usually the first thing to move when a good customer is about to leave.
A practical example, using this repo’s own results
This repository — customer-segmentation-profiling — ships with a full worked example instead of a hypothetical one. Running it with the defaults simulates a company generating 1,000 synthetic customer records (seed 42), with 5% of them deliberately corrupted to prove the validation step actually rejects bad data rather than silently letting it through: 950 records pass, 50 are rejected.
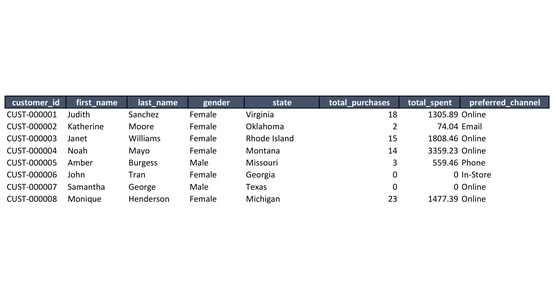
Every record carries what a real CRM export would: name, contact details, gender, birth date, location, signup date, last purchase date, total purchases, total spend, preferred channel, loyalty membership, and marketing opt-in. That’s the raw material every downstream number in the workbook is calculated from.
Catching bad records before they pollute the segments
Before any profile or segment is built, every generated record is checked against a strict schema: is the email actually shaped like an email, is the customer at least 18 at signup, does the purchase count/spend/last-purchase-date agree with each other, is gender one of the three allowed values. In this run, the 50 rejected records break down into eight distinct failure reasons:
| Reason rejected | Count |
|---|---|
total_purchases is 0 but total_spent/last_purchase_date is set |
8 |
| Customer under 18 years old at signup | 6 |
Invalid gender value |
6 |
last_purchase_date before signup_date |
14 |
| Malformed email address | 7 |
Empty first_name |
4 |
phone too short to be real |
3 |
Negative total_spent |
2 |
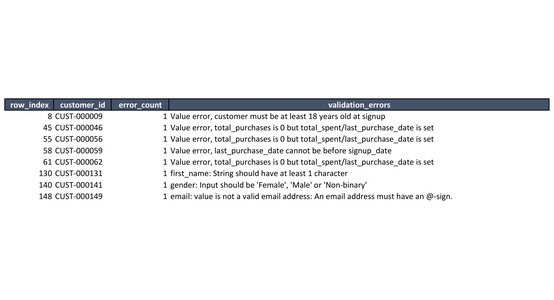
Fourteen of the fifty — the single largest failure reason — is a purchase dated before the customer signed up: exactly the kind of record that, left in, would quietly inflate an average tenure or drag a recency number in the wrong direction without anyone noticing. That’s the entire case for a validation tab: not that bad data is rare, but that it’s common enough to change the answer if it isn’t caught first.
The customer base at a glance
With 950 clean records to work from, the pipeline builds a descriptive profile before it attempts any segmentation — the numbers a marketing meeting would open with:
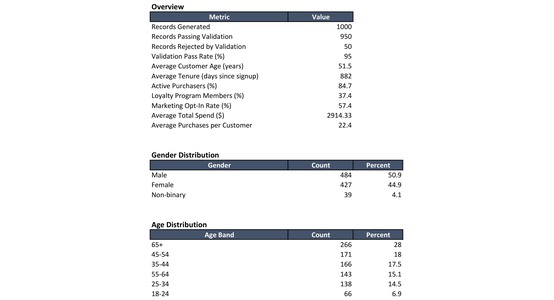
Average tenure is 882 days (a little over two years), average total spend is $2,914.33, and — the number worth sitting with — only 84.7% of clean customers are “active purchasers” at all (have made at least one purchase). Roughly 1 in 7 customers in this base has signed up and never bought anything. That single figure already tells a marketing team something a top-line revenue number never would: acquisition and activation are two separate problems, and this dataset has more of a problem with the second one than most people would guess from the average spend figure alone.
Two ways to segment, side by side
The same three signals — Recency (days since last purchase), Frequency (total purchases), and Monetary (total spend) — feed two independent segmentations, deliberately built two different ways so they can check each other:
- RFM rule-based scoring — each customer is scored 1–4 on R, F, and M (quartiles) and mapped to a named, business-readable segment: Champions, Loyal Customers, At Risk, Hibernating, and so on. Fully transparent, easy to explain to a non-technical stakeholder.
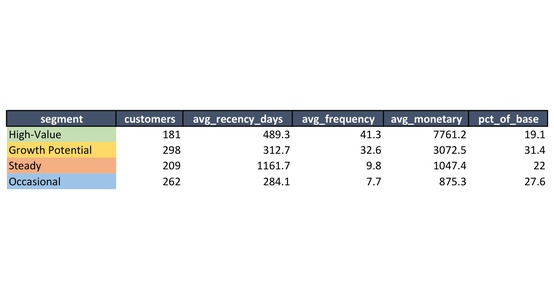
- KMeans clustering — an unsupervised alternative that clusters customers on the same three standardized features with no fixed rules, then ranks the resulting clusters by average monetary value into generic value tiers (High-Value, Growth Potential, Steady, Occasional).
The quiet story hiding behind “Champions”
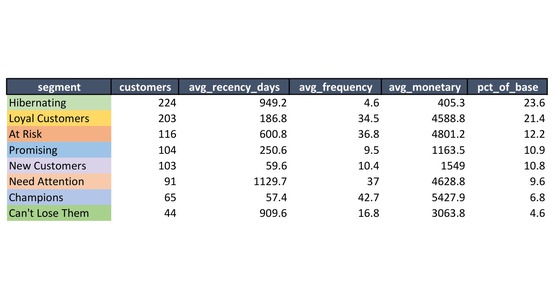
Champions — the freshest, most frequent, highest-spending customers under the RFM rules — are only 65 people (6.8% of the base), averaging $5,427.90 in lifetime spend and buying as recently as 57 days ago on average. That’s the segment every loyalty program is built to reward, and it’s the smallest one on the sheet.
Sitting right next to it are three segments that tell a less comfortable story: At Risk (116 customers, 12.2%), Need Attention (91 customers, 9.6%), and Can’t Lose Them (44 customers, 4.6%) — 251 customers in total, more than a quarter of the base. Their average spend — $4,801.20, $4,628.80, and $3,063.80 respectively — is close to, and in At Risk’s case actually higher than, the average Champion. The difference is recency: 601, 1,130, and 910 days on average since their last purchase, against Champions’ 57. These are customers who already proved they’ll spend real money — collectively about $1.11 million in historical spend across the three segments, over three times the $352,814 sitting with Champions — and they’ve gone quiet. A win-back campaign aimed at this group is working with people who have already shown they’ll buy; a blanket discount aimed at Hibernating (224 customers, average recency 949 days, average spend just $405.30) is mostly spent on people who probably won’t.
Where the rule-based and data-driven views disagree — and why that’s useful
The KMeans view, built with no fixed rules at all, puts 181 customers (19.1%) in High-Value — nearly three times the size of RFM’s Champions segment — and gives them an even higher average spend, $7,761.20, despite an average recency of 489 days, nowhere near as fresh as Champions’ 57. That’s not a bug in either method; it’s the two lenses doing exactly what they’re built to do. RFM’s quartile rules require a customer to be top-quartile on recency and frequency and monetary value simultaneously to earn the Champion label — so a customer who spent enormous amounts but hasn’t purchased in over a year gets excluded from Champions on the recency test alone, even though their lifetime value is undeniable. KMeans doesn’t apply that gate; it groups purely by distance across all three standardized features, so it happily lumps a very-high-spending, moderately-lapsed customer in with the freshest big spenders, because in three-dimensional feature space they are close together.
Neither answer is “more correct.” Run side by side, the disagreement itself is the useful signal: it flags exactly the pool of high-lifetime-value customers whose recency has started slipping — the same 250-ish customers the RFM view separately called At Risk, Need Attention, and Can’t Lose Them — before they fully cross over into KMeans’ lower-value tiers or RFM’s Hibernating bucket.
The business impact, in real numbers
Put the two views together and a single, concrete action falls out: the highest-value, highest-urgency segment to target this quarter isn’t Champions — they’re already buying — and it isn’t Hibernating — they’re gone. It’s the 251 At Risk / Need Attention / Can’t Lose Them customers, worth an average of $4,436 each in historical spend, whose collective $1.11 million in proven purchasing power is currently getting the same treatment as anyone else on the list. Even a modest win-back rate on that group — nudging a fraction of them back to a purchase — is worth pursuing before spending the same budget acquiring a new customer from scratch, who starts with no purchase history at all.
What to actually do with this, this week
- Pull your customer base into the same shape this repo uses: an ID, signup date, last purchase date, purchase count, total spend, channel, and whatever demographic fields you already collect.
- Run it through this repo’s pipeline (or a similar tool), swapping the Faker-based generator for your real CRM or e-commerce export.
- Check the Validation_Report tab first. A negative spend figure or a purchase dated before signup is a more common data-entry error than it looks, and it will skew every downstream average if it isn’t caught.
- On the RFM_Segment_Summary and KMeans_Segment_Summary tabs, don’t stop at Champions/High-Value. Cross-check average monetary value across all segments for customers whose spend rivals your best segment but whose recency has slipped — the At Risk/Need Attention pattern above.
- Prioritize win-back spend on that “high value, slipping recency” pool before spending the same budget acquiring new customers with no purchase history at all.
- Re-run this every quarter. Recency moves every single day by definition, so last quarter’s segmentation is already stale.
Try it yourself: a demo you can run in minutes
To make this concrete, this repository — customer-segmentation-profiling — is a small, self-contained, open-source demo. It:
- Generates (or accepts your own) customer records, using Faker for realistic synthetic data, with a configurable share deliberately corrupted.
- Validates every record against pydantic data contracts — bad emails, impossible ages, inconsistent purchase fields — so corrupted records are rejected with a clear reason instead of silently entering the analysis.
- Builds a descriptive profile of the clean customer base, then segments it two independent ways: RFM rule-based scoring and KMeans clustering.
- Writes everything — raw data, validation report, clean records, profile, and both segmentations with their summaries — into a single styled Excel workbook.
Downloading the code (no Git experience needed)
You don’t need to know Git or the command line to get the code onto your computer:
- Go to the repository: github.com/MattProtopapas/customer-segmentation-profiling
- Click the green
<> Codebutton near the top of the page. - Click “Download ZIP” in the dropdown.
- Right-click the downloaded ZIP and choose “Extract All…“ to unzip it into a regular folder.
- Open that folder — that’s the project. Ask your AI tool of choice (I used Claude) to set
up a Python environment and install the dependencies listed in
requirements.txt— no coding experience required to get it running.
If you’re comfortable with Git,
git clone https://github.com/MattProtopapas/customer-segmentation-profiling.git does the
same thing in one step.
Running the demo
The repository includes a full README.md, but the short version, from PowerShell:
python -m venv .venv
.\.venv\Scripts\Activate.ps1
pip install -r requirements.txt

python run_demo.py
That default run generates 1,000 synthetic customers and writes
output/customer_segmentation_demo.xlsx. A handful of CLI options let you reshape the
exercise without touching any code:
| Flag | Default | Description |
|---|---|---|
--num-customers |
1000 |
Number of synthetic customer records to generate |
--bad-record-rate |
0.05 |
Fraction of records deliberately corrupted, to test validation |
--seed |
42 |
Random seed (Faker, random, KMeans) for reproducible runs |
--kmeans-clusters |
4 |
Number of clusters for the KMeans segmentation |
--output |
output/customer_segmentation_demo.xlsx |
Output workbook path |
For example, a larger, differently-seeded batch with more clusters:
python run_demo.py --num-customers 2500 --bad-record-rate 0.08 --seed 7 --kmeans-clusters 5 --output output/q3_customers.xlsx
Note: the data generated by this demo is synthetic and randomly generated, and this project is intended for educational and demonstration purposes only — the RFM thresholds and KMeans tier labels are illustrative, not calibrated against any real business. See the repository’s Disclaimer & EULA for details. It’s a starting point for understanding how customer segmentation works, not a production CRM or marketing platform.
Understanding the results
customer_segmentation_demo.xlsx has eight tabs, each one a stage of the pipeline: Raw_Generated_Data
(every record as generated, including the corrupted ones), Validation_Report (only the
rejected records, with the reason for each), Clean_Customers (the subset everything else is
built on), Customer_Profile (the descriptive summary), RFM_Segmentation and
RFM_Segment_Summary (per-customer scores and the rolled-up segment table), and
KMeans_Segmentation and KMeans_Segment_Summary (the clustering equivalent). The five
screenshots earlier in this post are pulled from Clean_Customers, Validation_Report,
Customer_Profile, RFM_Segment_Summary, and KMeans_Segment_Summary, in that order.
RFM_Segmentation and KMeans_Segmentation aren’t pictured because they’re long, one-row-
per-customer detail (950 rows each) — useful for looking up an individual customer’s score,
but not a tab you read top to bottom. Every segment column across the tabs is color-coded, so
the segment tabs are scannable at a glance rather than requiring a filter.
The limits worth keeping in mind
Customer profiling and segmentation, like the other tools covered on this blog, is a genuinely useful framework with real limits:
- It describes, it doesn’t explain. RFM and KMeans both tell you who is high-value or lapsing, not why — that still takes a human looking at the channel mix, the product line, or a support ticket history.
- The rules and tiers are illustrative here. The RFM quartile thresholds and the KMeans tier labels in this demo aren’t calibrated to any real business; a real deployment should sanity-check the resulting segment sizes against what the business actually looks like.
- It reflects the past. A customer’s RFM score is a snapshot; buying habits, life events, and competitor offers all shift it, which is exactly why re-running this quarterly matters more than getting one run perfect.
- Clustering needs a sensible number of clusters. KMeans was told to find 4 clusters in this run; a different number can produce a meaningfully different — not necessarily wrong — picture of the same customers.
None of that makes the exercise less worthwhile. It just means the output of a segmentation run is an input to a marketing or retention decision, not the decision itself — in the same way the market basket rules, portfolio weights, and capital project rankings from earlier posts are inputs to a decision, not a replacement for judgment. Used that way, RFM and KMeans together turn “we think our regulars matter most” into “here are the 251 customers who already proved they’ll spend real money and are quietly slipping away” — a genuinely useful upgrade for any company’s marketing and retention planning, using nothing more than the customer data that’s already sitting in a CRM export.