Ask the owner of a small distribution business how the delivery routes were decided and the answer is usually a story: “Nikos has driven the north run for ten years, so he knows it.” Ask why the depot is where it is and the answer is another story: “It was the cheapest unit we could find when we started.” Both decisions are made once, rarely revisited, and repeated every working day for years. A van that drives 20 kilometres further than it needs to, 250 days a year, is a cost nobody ever sees on an invoice.
This blog keeps returning to one idea: replace gut feel with a number. The inventory control post put a number on how much stock to hold; the staffing post put one on how many people a Saturday needs; the OTIF post measured whether orders arrive on time. This post turns to the physical side of the same question: where should the depot be, and what route should each vehicle drive? The method is location and routing optimization — evaluate every candidate site, plan the routes from each one, and compare the total annual cost of the whole set-up, not just the rent.
For a small or medium-sized company this matters for a simple reason: transport is usually one of the three or four biggest controllable costs, and it is controlled almost entirely by habit. You do not need a logistics department or specialised software to ask the question properly. The arithmetic is old, the inputs are a customer list with addresses, and the answer fits in an Excel workbook.
What location and routing optimization actually gives you
| Benefit | Why it matters for an SME |
|---|---|
| A real price tag on the depot decision | Every candidate site is compared on one number: fixed site cost plus the cost of driving the routes from it. A cheap site far from your customers can cost more than an expensive central one — and the reverse. |
| Routes that waste fewer kilometres | The routes are built to keep stops that are close together on the same vehicle, in a sensible order, instead of in the order the orders came in. Fewer kilometres means less fuel, less wear and less driver time. |
| A check on how many vehicles you really need | Vehicle count is driven by capacity: total daily load divided by what one vehicle carries. The plan shows how full each vehicle really is and where one half-empty run is quietly costing you a whole vehicle. |
| A fair test of “should we open a second depot?” | The tool re-plans the routes for one, two or three depots and shows what each does to the total. A second site only pays if it saves more driving than it adds in fixed cost. |
| A baseline to beat | The workbook compares the optimized plan with a naive one that simply fills vehicles in the order customers appear in the data — roughly what an unplanned system does — so the saving is stated in euros, not adjectives. |
| Plans a driver can follow | Every route comes out as a list of stops in order, with load and duration, ready to print or paste into a navigation app. |
| Bad data never reaches the plan | A validation step rejects coordinates that don’t exist, negative demand, unknown location types, blanks and duplicates before anything is optimized. |
A practical example, using this repo’s own results
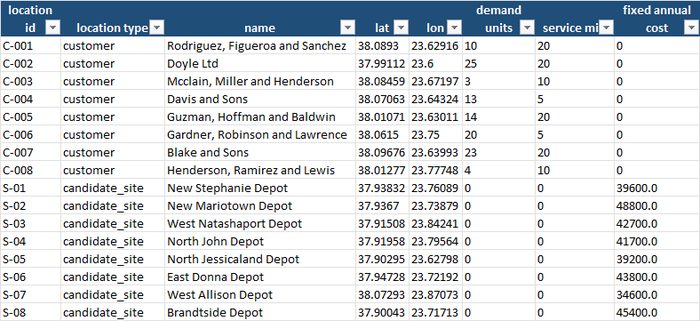
This repository — Location-routing-optimization — ships with a full worked example. The scenario is a fictitious small distributor serving customers around greater Athens: 40 delivery stops clustered in four neighbourhoods, each with a daily demand in units and a service time at the door, plus eight candidate depot sites, each with a yearly fixed cost that is higher the closer it is to the centre. Vehicles carry 100 units, may be out for at most 8 hours, average 30 km/h in the city, and cost €0.65 per kilometre plus €120 a day for the vehicle and driver. The network operates 250 days a year.
The raw file has 49 rows — 40 customers, 8 sites and one deliberately duplicated record. The validator rejected 3: one with a customer mislabelled as a depot candidate (a site with no yearly cost), one with a blank name, and the duplicate of site S-08. That leaves 38 customers and 8 candidate sites. Note what that means in real life: two genuine customers dropped out of the plan because of bad data, and a validation report that does not get read means two customers who never get a delivery slot.
Where to put the depot: the answer is closer than you’d think
The Site Comparison tab evaluates every candidate, plans the routes from it, and ranks them by total annual cost:
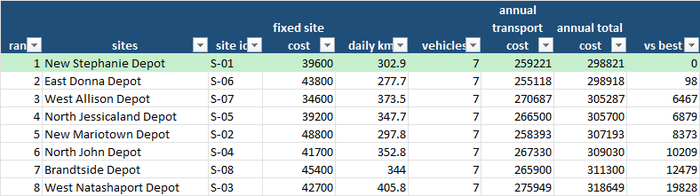
The best site, New Stephanie Depot, costs €298,821 a year in total — €39,600 of site cost plus €259,221 of transport. The worst, West Natashaport, costs €318,649. The site decision alone is worth €19,828 a year, about 6% of the total, for the price of looking at all eight.
Two details are more instructive than the winner:
- The runner-up is a near tie. East Donna Depot costs €98 a year more. It rents for €4,200 more but saves 25 km a day on the road — the two effects nearly cancel. When two options are that close, the number has done its job: it tells you the decision should be made on something the model cannot see, such as lease terms, access for lorries or growth room.
- The cheapest site is not the cheapest option. West Allison Depot has the lowest fixed cost of the eight (€34,600) but sits far enough out that the vans drive about 70 extra kilometres a day. It finishes third, €6,467 a year behind the winner. A rent saving that looks decisive on a lease comparison is overwhelmed by the daily driving it causes.
What the routes look like
The Summary tab states the plan in business terms:
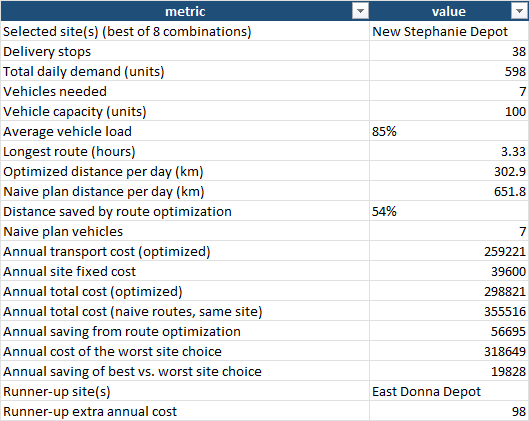
The optimized plan needs 7 vehicles to deliver 598 units a day across 38 stops, driving 302.9 km a day. The naive plan — vehicles filled in data order — needs the same 7 vehicles but drives 651.8 km: more than double. The difference, 349 km a day over 250 days at €0.65, is €56,695 a year, a 16% saving on the total, from nothing more than putting nearby customers on the same van in a sensible order.
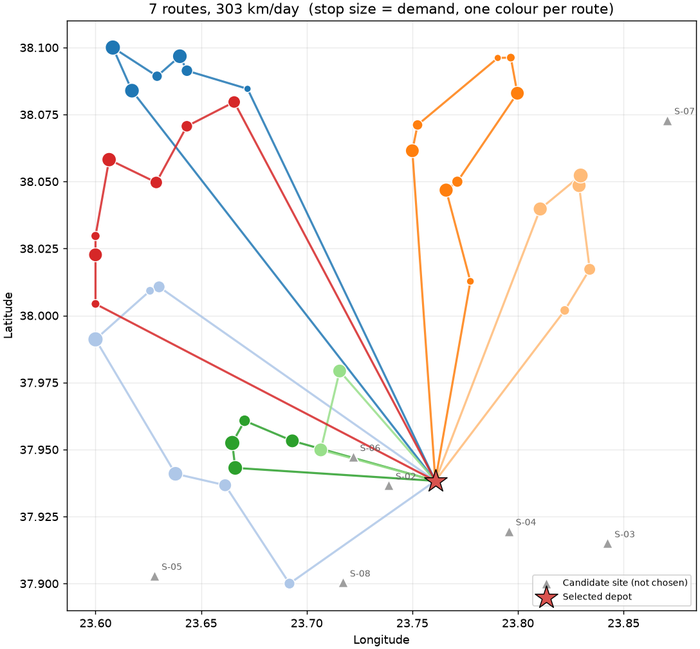
The map is the quickest way to see what is going on. Each colour is one vehicle; each dot is a customer, sized by demand. Because the depot sits at the southern edge of the network, most routes begin with a long drive out to a cluster of customers, work their way round it and come back — the long legs are the price of that site, and the reason the site comparison matters.
The Routes tab gives each vehicle’s load, distance and duration:
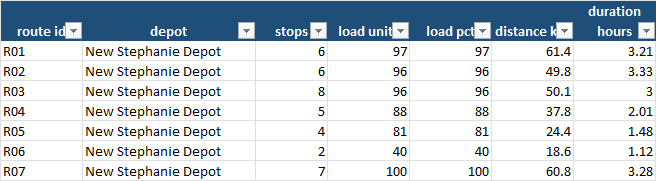
Read down the load column and two things stand out. Six of the seven vehicles are filled to 81–100%. One, route R06, carries 40 units on two stops — a vehicle and driver costing €120 a day for 40% of a load. And the longest route takes 3.3 hours against an allowed 8: capacity, not time, is what determines how many vehicles are needed. That is useful to know. It says the lever for cost is not squeezing drivers’ hours; it is how cleanly the daily load packs into vehicles.
A word on the arithmetic of that. 598 units divided by a 100-unit vehicle is 5.98, so six vehicles would need to leave 99.7% full — not realistic with 38 separate drop sizes. Seven is the right answer for this load. But the vehicle-and-driver cost is €210,000 a year, 81% of the transport bill, against only €49,000 for fuel and running costs. A day with a few more or fewer units of demand can tip the plan from seven vehicles to eight, which is why capacity — a 120-unit van, or a smaller delivery window for a shared customer — is worth pricing before the next route review.
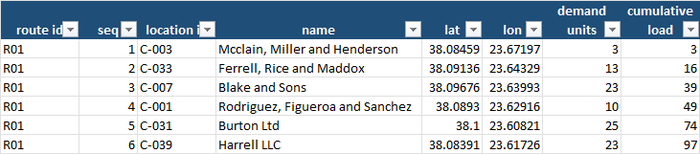
Finally, Route Stops gives the stop-by-stop sequence, with the cumulative load, that a driver or dispatcher can actually use:
Should we open a second depot?
The question every growing distributor asks. The demo can answer it by changing one flag:
--num-sites 2 evaluates all 28 pairs of sites, --num-sites 3 all 56 triples. Here is
what happens:
| Depots | Best combination | Vehicles | km/day | Total annual cost |
|---|---|---|---|---|
| 1 | New Stephanie | 7 | 303 | €298,821 |
| 2 | North Jessicaland + West Allison | 7 | 271 | €327,791 |
| 3 | New Stephanie + North Jessicaland + West Allison | 7 | 289 | €370,402 |
A second depot cuts daily distance by about 10%, which saves roughly €5,000 a year in running costs, but adds €34,000 of fixed cost. It would pay for itself only with more customers, longer routes, or a high enough vehicle cost that the shorter distance freed up an entire vehicle — and in this network it does not. The point is not that one depot is always right. It is that the question has an answer you can calculate, instead of a gut feeling about “being closer to the customer”.
The business impact, in real numbers
Put a cost on what the workbook found:
- Routing the same 38 stops sensibly saves €56,695 a year against the naive plan, 16% of the whole bill, with no change to vehicles, depot or customers.
- Choosing the right depot is worth up to €19,828 a year against the worst site — and the cheapest-to-rent site was not the best one.
- Two sites were effectively tied (€98 a year apart), which tells you where to stop optimizing and start negotiating.
- A second depot would cost about €29,000 a year more, not less, on this network.
- Vehicle cost, not fuel, is the real lever. 81% of the transport bill is the vehicle-and-driver day rate; the half-empty vehicle on route R06 is the most expensive line on the plan.
- The data-quality dividend. Two customers were dropped because of corrupted records. A plan built on an unvalidated list silently misses them.
What to actually do with this, this week
- Export your delivery list with coordinates and demand. One row per customer, with latitude and longitude (any spreadsheet mapping add-on will geocode addresses), the typical load per drop and the time spent at the door. This is the input file.
- List every depot or yard you could realistically use, including the one you already have, with its yearly cost. Include the awkward options — you want the comparison to be honest.
- Run the plan for your current site first and read the Summary tab. If the naive-versus-optimized gap is large, route planning alone is your first saving.
- Look at the load column before anything else. A vehicle that is half-empty is a conversation about delivery days, minimum orders or customer groupings.
- Compare sites on total cost, not rent. Check the gap between the best site and the runner-up; if it is small, decide on the things the model cannot see.
- Re-run it when the customer list changes by 10–15%. Routes drift; the plan should be refreshed when your customers move.
Try it yourself: a demo you can run in minutes
To make this concrete, Location-routing-optimization is a small, self-contained, open-source Python pipeline. It:
- Generates a fake delivery network around Athens — customers clustered in neighbourhoods with demand and service times, and candidate depot sites whose rent rises towards the centre — with a configurable share of deliberately corrupted rows.
- Validates every row against a strict schema, drops duplicates and writes a rejection report with a reason for each dropped row.
- Evaluates every site combination, plans the vehicle routes for each, and writes the result into a 6-tab Excel workbook plus a route map.
Downloading the code (no Git experience needed)
You don’t need to know Git or the command line to get the code onto your computer:
- Go to the repository: github.com/MattProtopapas/Location-routing-optimization
- Click the green
<> Codebutton near the top of the page. - Click “Download ZIP” in the dropdown.
- Right-click the downloaded ZIP and choose “Extract All…“ to unzip it into a regular folder.
- Open that folder — that’s the project. Ask your AI tool of choice (I used Claude) to
set up a Python environment and install the dependencies listed in
requirements.txt— no coding experience required to get it running.
If you’re comfortable with Git,
git clone https://github.com/MattProtopapas/Location-routing-optimization.git does the
same thing in one step.
Running the demo
The repository includes a full README.md, but the short version, from PowerShell
(requires Python 3.10+; the optimization itself is plain standard-library Python —
matplotlib is only used for the map):
python -m venv .venv
.\.venv\Scripts\Activate.ps1
pip install -r requirements.txt

python generate_data.py --customers 40 --sites 8 --error-rate 0.05 --seed 42   # step 1: fake delivery network
python validate_data.py                                                         # step 2: schema checks, rejection report
python analyze_routes.py --num-sites 1                                          # step 3: site selection + routing -> Excel + map
Then open output/routing_analysis.xlsx. With --seed 42 you’ll get exactly the numbers
quoted in this post; the workbook committed to the repository’s output/ folder was
produced the same way, so you can also just browse it on GitHub without running anything.
Try --num-sites 2 to see where a second depot would go, and the options on the
analysis step to match your own business: --vehicle-capacity, --max-route-hours,
--speed-kmh, --cost-per-km, --vehicle-daily-cost and --operating-days. Changing
the vehicle capacity from 100 to 120 is a quick way to see how much of the bill is the
number of vans.
Every input and output path is defined in one place in routing_common.py, so once
you’re comfortable with the demo you can drop your own customer and site list — one row
per location with a type, coordinates, daily demand, service time and, for candidate
sites, a yearly cost — into data/, skip generate_data.py entirely, and run
validate_data.py and analyze_routes.py straight on your own network.
Note: the sample data shipped with this repo is synthetic and randomly generated, and this project is intended for educational and demonstration purposes only — see the repository’s Disclaimer & EULA for details. It’s a starting point for understanding how site selection and vehicle routing work, not a fleet-management system.
Understanding the results
The workbook — output/routing_analysis.xlsx — has six tabs.
The verdict. Summary — the key numbers in one table: stops, daily demand, vehicles, average load, longest route, kilometres, costs, and the savings against the naive plan and the worst site. It is the one tab to hand to whoever signs off the budget.
The comparison. Site Comparison — every site (or combination) ranked by total annual cost, best highlighted, with the gap to the best in the last column.
The plan. Routes — one row per vehicle: stops, load, load percentage, distance, duration and the stop sequence. Route Stops — the same, one row per stop, with coordinates and cumulative load. Route Map — the picture above.
The input. Input Data is the validated location file exactly as the optimizer read
it. Alongside it, data/validation_report.txt lists every rejected row and why.
The limits worth keeping in mind
Location and routing optimization, like every tool covered on this blog, is genuinely useful within real limits:
- Distances are estimates. The tool uses straight-line distance multiplied by 1.3 to approximate roads, and a flat 30 km/h. Real routes have one-way streets, rivers and rush hours. For a real decision, replace the distance matrix with one from a routing service.
- The routes are very good, not provably the best. The method — merging routes where it saves the most distance, then removing crossing legs within each route — is a well-known heuristic, typically within a few percent of the optimum. Treat the plan as a strong starting point, not a certificate.
- Delivery windows and driver rules are missing. There are no customer opening hours, mixed vehicle sizes, break rules or return loads. Each would make the real plan costlier than the model’s.
- One day stands in for 250. Demand varies by day of the week and the season, so a plan built on an average day will be wrong on a peak day. Re-run it on your busiest day as well.
- Site costs come from the list you gave it. The result is only as good as your estimate of rent, rates and staffing for each candidate. Sensitivity matters here: the winner and runner-up were €98 apart.
- Two real customers were lost to bad data. The validation step caught them; it can’t fix them. Read the rejection report and repair the rows.
None of that diminishes the core value. The customer list already exists. The routing arithmetic is decades old and runs in seconds on a laptop. What it changes is not that you have a depot and a set of routes, but that you know what they cost — and, when the honest answer is “about the same as the alternative”, that you can stop worrying and spend the effort on the next decision, such as how many staff you need to load the vans in the morning.